1994 North Indian Ocean cyclone season
| |
| Season summary map |
| First system formed |
March 21, 1994 |
| Last system dissipated |
November 20, 1994 |
| Strongest storm1 |
BOB 01 – 940 hPa (mbar), 215 km/h (130 mph) (3-minute sustained) |
| Depressions |
5 |
| Cyclonic storms |
4 |
| Severe cyclonic storms |
2 |
| Very severe cyclonic storms |
2 |
| Total fatalities |
315 |
| Total damage |
> $12.5 million (1994 USD) |
| 1Strongest storm is determined by lowest pressure |
North Indian Ocean tropical cyclone seasons
1992, 1993, 1994, 1995, 1996 |
The 1994 North Indian Ocean cyclone season was the period in which tropical cyclones formed within the north Indian ocean. The season has no official bounds but cyclones tend to form within this basin between April and December. There are two main seas in the North Indian Ocean — the Bay of Bengal to the east of the Indian subcontinent and the Arabian Sea to the west of India. The official Regional Specialized Meteorological Centre in this basin is the India Meteorological Department (IMD), while the Joint Typhoon Warning Center releases unofficial advisories. An average of four to six storms form in the North Indian Ocean every season with peaks in May and November. Cyclones occurring between the meridans 45°E and 100°E are included in the season by the IMD.
Season summary
During 1994 a below average total of eight cyclonic disturbances were recorded during the year, by the India Meteorological Department (IMD) and Joint Typhoon Warning Center (JTWC).[nb 1][1][2] This included six systems in the Bay of Bengal and two systems over the Arabian Sea.[1][2] The first system occurred between March 21–24, but did not affect any land as it became the first cyclonic disturbance to form over the basin during March since 1939.[1]
Storms
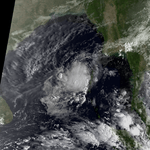
Depression BOB 01 (01B)
| Depression (IMD) |
| Tropical storm (SSHWS) |
|
|
| Duration |
March 21 – March 24 |
| Peak intensity |
45 km/h (30 mph) (3-min) |
On March 20, the JTWC started to monitor an area of convection, that had developed to the south-west of the Andaman Islands.[3] The system subsequently moved northwards and became the subject of a tropical cyclone formation alert, before it was declared a depression by the IMD late on March 21, as it peaked with 3-minute sustained windspeeds of 45 km/h (30 mph).[1][3] The system was subsequently classified as Tropical Cyclone 04B by the JTWC during the next day, before it peaked with 1-minute sustained wind speeds of 75 km/h (45 mph).[3] The system was subsequently last noted by the IMD during March 24, as it weakened into an area of low pressure, before the JTWC issued their final advisory early the next day as the system turned southwards over the sea.[1][3]
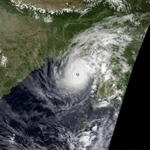
Extremely Severe Cyclonic Storm BOB 02
| Extremely severe cyclonic storm (IMD) |
| Category 4 tropical cyclone (SSHWS) |
|
|
| Duration |
April 26 – May 2 |
| Peak intensity |
215 km/h (130 mph) (3-min) 940 hPa (mbar) |
A tropical depression formed in the southeastern Bay of Bengal on April 26. It followed a path and intensity very similar to the 1991 Bangladesh Cyclone, and became a tropical storm on the 29th. On the 30th it became a cyclone while turning north-northeastward, and on May 2 the cyclone reached a peak of 145 mph winds. It weakened to a 130 mph cyclone before hitting near the Bangladesh/Myanmar border later that day. Massive evacuation efforts and minor storm surge due to a low tide led to 285 casualties, a fraction of the similar 1991 cyclone that killed 138,000. It still caused flooding amounting to $125 million (1994 USD).
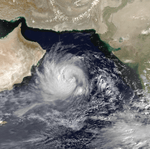
Severe Cyclonic Storm ARB 01
| Severe cyclonic storm (IMD) |
| Tropical storm (SSHWS) |
|
|
| Duration |
June 5 – June 9 |
| Peak intensity |
100 km/h (65 mph) (3-min) 980 hPa (mbar) |
On June 5, a surface low organized into a tropical depression over western India. It moved to the west, becoming a tropical storm on the 7th and reached a peak of 50 mph later that day. The storm steadily weakened before dissipating over Oman on the 9th.
Deep Depression
| Deep depression (IMD) |
|
|
| Duration |
August 17 – August 21 |
| Peak intensity |
55 km/h (35 mph) (3-min) |
Deep Depression
| Deep depression (IMD) |
|
|
| Duration |
October 4 – October 7 |
| Peak intensity |
55 km/h (35 mph) (3-min) |
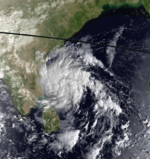
Severe Cyclonic Storm BOB 03
| Severe cyclonic storm (IMD) |
| Tropical storm (SSHWS) |
|
|
| Duration |
October 28 – October 31 |
| Peak intensity |
110 km/h (70 mph) (3-min) 988 hPa (mbar) |
A tropical disturbance developed into a tropical depression over the western Bay of Bengal on October 28. It headed slowly westward, reaching tropical storm strength and a peak of 70 mph before hitting India and dissipating on the 31st.
Depression
| Depression (IMD) |
|
|
| Duration |
November 4 – November 5 |
| Peak intensity |
45 km/h (30 mph) (3-min) |
Very Severe Cyclonic Storm ARB 02
| Very severe cyclonic storm (IMD) |
| Tropical storm (SSHWS) |
|
|
| Duration |
November 13 – November 20 |
| Peak intensity |
120 km/h (75 mph) (3-min) 984 hPa (mbar) |
An area of convection consolidated into Tropical Depression 5A on November 13 in the Arabian Sea. After moving northwestward, it turned to the west-southwest, strengthening to a tropical storm on the 16th and reaching a peak of 65 mph winds before hitting Somalia and dissipating on the 20th.
There were 30 deaths in Somalia.[4]
Season effects
Notes
- ↑ On average sixteen cyclonic disturbances and Six tropical cyclones develop during the year.[1]
See also
References
- 1 2 3 4 5 6 Regional Specialised Meteorological Centre (RSMC) - Tropical Cyclones, New Delhi (January 1995). "2. Detailed description of cyclonic disturbances: 2.1 Pre-monsoon season (March–May)". Report on Cyclonic Disturbances (Depressions and Tropical Cyclones) over North Indian Ocean in 1994 (PDF) (Report). India Meteorological Department. pp. 22–25. Archived (PDF) from the original on February 23, 2015. Retrieved February 23, 2015.
- 1 2 "3.2 North Indian Ocean Tropical Cyclones". 1994 Annual Tropical Cyclone Report (PDF). Joint Typhoon Warning Center (Report). United States Navy, United States Airforce. Retrieved January 19, 2015.
- 1 2 3 4 "3.2 North Indian Ocean Tropical Cyclones". 1990 Annual Tropical Cyclone Report (PDF). Joint Typhoon Warning Center (Report). United States Navy, United States Airforce. Retrieved January 19, 2015.
- ↑ Allaby, M.; Garratt, R. (2004). A Chronology of Weather. Facts On File, Incorporated. p. 58. ISBN 9781438108629. Retrieved June 7, 2015.
External links


