Barnet London Borough Council election, 1998
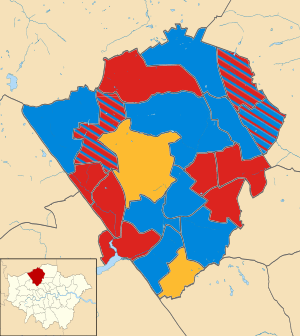
Map of the results of the 1998 Barnet council election. Conservatives in blue, Labour in red and Liberal Democrats in yellow.
The 1998 Barnet Council election took place on 7 May 1998 to elect members of Barnet London Borough Council in London, England. The whole council was up for election and the council stayed under no overall control.[1]
Election result
Overall turnout in the election was 35.9%.
| Barnet Local Election Result 1998[1] | ||||||||||
|---|---|---|---|---|---|---|---|---|---|---|
| Party | Seats | Gains | Losses | Net gain/loss | Seats % | Votes % | Votes | +/− | ||
| Conservative | 28 | 1 | 2 | -1 | 46.7 | 38.5 | 89,529 | |||
| Labour | 26 | 2 | 1 | +1 | 43.3 | 40.0 | 92,954 | |||
| Liberal Democrat | 6 | 0 | 0 | 0 | 10.0 | 16.3 | 37,846 | |||
| Green | 0 | 0 | 0 | 0 | 0 | 4,747 | ||||
| Natural Law | 0 | 0 | 0 | 0 | 0 | 41 | ||||
Ward results
Arkley
| Party | Candidate | Votes | % | ± | |
|---|---|---|---|---|---|
| Labour | Anita Campbell | 2,288 | |||
| Labour | Pamela Coleman | 2,075 | |||
| Labour | Pauline V. M. Coakley-Webb | 2,072 | |||
| Conservative | Mark Johnson | 1,907 | |||
| Conservative | Andrew W. Knight | 1,795 | |||
| Conservative | Tony Mirza | 1,724 | |||
| Liberal Democrat | Victor F. Godman | 470 | |||
| Liberal Democrat | Nicholas O. Sullivan | 460 | |||
| Liberal Democrat | Michael M. Cole | 441 | |||
| Green | Aniel Paranjpe | 186 | |||
| Turnout | 4,754 | 39.4 | |||
| Labour hold | Swing | ||||
| Labour hold | Swing | ||||
| Labour hold | Swing | ||||
Brunswick Park
| Party | Candidate | Votes | % | ± | |
|---|---|---|---|---|---|
| Labour | Geoffrey N. Cooke | 1,826 | |||
| Conservative | Andreas Tambourides | 1,781 | |||
| Conservative | Lynne Hillan | 1,774 | |||
| Labour | Paul G. Rogers | 1,700 | |||
| Labour | Michael J. P. Marshall | 1,689 | |||
| Conservative | Arik Yacobi | 1,653 | |||
| Liberal Democrat | Peter J. Finlayson | 446 | |||
| Liberal Democrat | Peter D. Watkins | 383 | |||
| Liberal Democrat | Charles E. Wicksteed | 341 | |||
| Turnout | 4,164 | 38.4 | |||
| Labour gain from Conservative | Swing | ||||
| Conservative hold | Swing | ||||
| Conservative hold | Swing | ||||
Burnt Oak
| Party | Candidate | Votes | % | ± | |
|---|---|---|---|---|---|
| Labour | Allan J. Turner | 1,844 | |||
| Labour | Alan J. Williams | 1,830 | |||
| Labour | Linda R. McFadyen | 1,615 | |||
| Conservative | Peter J. P. Edwards | 430 | |||
| Conservative | Urmil K. Bhatt | 317 | |||
| Conservative | Keith F. Dyall | 316 | |||
| Liberal Democrat | Andrew Packer | 289 | |||
| Liberal Democrat | Karen S. Hatchett | 215 | |||
| Liberal Democrat | Henryk P. Feszczur | 159 | |||
| Turnout | 2,649 | 27.4 | |||
| Labour hold | Swing | ||||
| Labour hold | Swing | ||||
| Labour hold | Swing | ||||
Childs Hill
| Party | Candidate | Votes | % | ± | |
|---|---|---|---|---|---|
| Liberal Democrat | Jack B. Cohen | 1,422 | |||
| Liberal Democrat | Monroe E. Palmer | 1,407 | |||
| Liberal Democrat | Susette S. Palmer | 1,380 | |||
| Labour | Lorna Noble | 1,047 | |||
| Labour | Clare Fitzpatrick | 1,015 | |||
| Labour | Keith T. Priddle | 953 | |||
| Conservative | Jonathan Miller | 872 | |||
| Conservative | Peter M. Sugarman | 872 | |||
| Conservative | Marc A. Shaw | 790 | |||
| Turnout | 3,461 | 35.6 | |||
| Liberal Democrat hold | Swing | ||||
| Liberal Democrat hold | Swing | ||||
| Liberal Democrat hold | Swing | ||||
Colindale
| Party | Candidate | Votes | % | ± | |
|---|---|---|---|---|---|
| Labour | Danish Chopra | 1,715 | |||
| Labour | Gillian W. Sargeant | 1,589 | |||
| Labour | Nathaniel D. Rudolf | 1,464 | |||
| Conservative | Robert B. Linton | 485 | |||
| Conservative | Kirit K. Patel | 452 | |||
| Conservative | Yvonne W. Prentice | 437 | |||
| Liberal Democrat | Arthur J. Roycroft | 337 | |||
| Liberal Democrat | Guy J. Patton | 332 | |||
| Liberal Democrat | Michael C. Roberts | 315 | |||
| Green | Ketan K. Majmudar | 159 | |||
| Turnout | 2,799 | 23.1 | |||
| Labour hold | Swing | ||||
| Labour hold | Swing | ||||
| Labour hold | Swing | ||||
East Barnet
| Party | Candidate | Votes | % | ± | |
|---|---|---|---|---|---|
| Labour | Elizabeth A. T. Jarvis | 2,041 | |||
| Labour | Usha K. Chopra | 1,962 | |||
| Conservative | Olwen M. Evans | 1,942 | |||
| Conservative | Zoe Ford | 1,914 | |||
| Labour | Brenda E. A. Sandford | 1,914 | |||
| Conservative | James E. Hawthorn | 1,873 | |||
| Liberal Democrat | David J. Keech | 432 | |||
| Liberal Democrat | Elizabeth R. Wardle | 423 | |||
| Liberal Democrat | Renee L. Wheeler | 351 | |||
| Green | Raymond White | 256 | |||
| Turnout | 4,657 | 40.8 | |||
| Labour hold | Swing | ||||
| Labour hold | Swing | ||||
| Conservative gain from Labour | Swing | ||||
East Finchley
| Party | Candidate | Votes | % | ± | |
|---|---|---|---|---|---|
| Labour | Helen E. Gordon | 2,750 | |||
| Labour | Alison Moore | 2,547 | |||
| Labour | Philip R. Yeoman | 2,529 | |||
| Conservative | Barry P. Neville | 850 | |||
| Conservative | Michael W. Freer | 822 | |||
| Conservative | Graham D. Old | 786 | |||
| Green | Noel T. Lynch | 577 | |||
| Liberal Democrat | Joyce M. Arram | 458 | |||
| Liberal Democrat | Elinor T. Edwards | 358 | |||
| Green | Sally M. Rose | 355 | |||
| Liberal Democrat | Thomas G. Darrer | 334 | |||
| Green | Denis E. Vigay | 237 | |||
| Turnout | 4,542 | 38.8 | |||
| Labour hold | Swing | ||||
| Labour hold | Swing | ||||
| Labour hold | Swing | ||||
Edgware
| Party | Candidate | Votes | % | ± | |
|---|---|---|---|---|---|
| Conservative | Anthony P. Spencer | 1,642 | |||
| Conservative | Malcolm E. Lester | 1,592 | |||
| Conservative | Joan Scannell | 1,532 | |||
| Labour | Maree G. Glass | 1,206 | |||
| Labour | Harold Waterman | 1,148 | |||
| Labour | Alan M. Sloam | 1,120 | |||
| Liberal Democrat | Barbara A. Farbey | 324 | |||
| Liberal Democrat | June D. Burton | 323 | |||
| Liberal Democrat | Diana C. Iwi | 247 | |||
| Green | Jonathan D. Mulberg | 141 | |||
| Turnout | 3,382 | 28.9 | |||
| Conservative hold | Swing | ||||
| Conservative hold | Swing | ||||
| Conservative hold | Swing | ||||
Finchley
| Party | Candidate | Votes | % | ± | |
|---|---|---|---|---|---|
| Conservative | Eva Greenspan | 1,973 | |||
| Conservative | Leslie Sussman | 1,882 | |||
| Conservative | Barbara I. Langstone | 1,829 | |||
| Labour | Clare Furniss | 1,523 | |||
| Labour | Ilan A. Jacobs | 1,441 | |||
| Labour | Mary P. McGuirk | 1,425 | |||
| Liberal Democrat | Malcolm B. Davis | 501 | |||
| Green | Ashley Gunstock | 365 | |||
| Liberal Democrat | Rita D. Druiff | 346 | |||
| Liberal Democrat | Millicent J. Watkins | 332 | |||
| Turnout | 4,105 | 38.8 | |||
| Conservative hold | Swing | ||||
| Conservative hold | Swing | ||||
| Conservative hold | Swing | ||||
Friern Barnet
| Party | Candidate | Votes | % | ± | |
|---|---|---|---|---|---|
| Conservative | James J. Chapman | 2,107 | |||
| Conservative | Brian L. Salinger | 1,966 | |||
| Conservative | John C. Tiplady | 1,924 | |||
| Labour | Ross S. Houston | 1,407 | |||
| Labour | Timothy J. K. Roberts | 1,372 | |||
| Labour | Dilip K. Mitra | 1,310 | |||
| Liberal Democrat | Neil A. McL. Ferguson | 446 | |||
| Liberal Democrat | Tanya G. Jordan | 426 | |||
| Liberal Democrat | Yvonne Wicksteed | 388 | |||
| Green | Miranda J. Dunn | 238 | |||
| Turnout | 4,153 | 37.0 | |||
| Conservative hold | Swing | ||||
| Conservative hold | Swing | ||||
| Conservative hold | Swing | ||||
Garden Suburb
| Party | Candidate | Votes | % | ± | |
|---|---|---|---|---|---|
| Conservative | John L. Marshall | 2,649 | |||
| Conservative | Peter J. Skolar | 2,073 | |||
| Conservative | Yasman Naghar | 2,024 | |||
| Liberal Democrat | Majorie A. Harris | 1,312 | |||
| Liberal Democrat | Steven Hajioff | 1,229 | |||
| Liberal Democrat | Steven J. Deller | 1,068 | |||
| Labour | Carol A. Kohli | 531 | |||
| Labour | Anthony G. J. Hulstrom | 450 | |||
| Labour | Polly A. Napper | 443 | |||
| Green | Louise E. Gunstock | 256 | |||
| Turnout | 4,314 | 42.0 | |||
| Conservative hold | Swing | ||||
| Conservative hold | Swing | ||||
| Conservative hold | Swing | ||||
Golders Green
| Party | Candidate | Votes | % | ± | |
|---|---|---|---|---|---|
| Conservative | Melvin Cohen | 1,946 | |||
| Conservative | Abraham M. Dunner | 1,946 | |||
| Conservative | Christopher G. S. Harris | 1,762 | |||
| Labour | David G. Robinson | 1,617 | |||
| Labour | Alan Schneiderman | 1,579 | |||
| Labour | Matthew G. B. Staples | 1,533 | |||
| Liberal Democrat | Olive V. Ellner | 397 | |||
| Liberal Democrat | Peter A. Lusher | 344 | |||
| Liberal Democrat | Simon V. Kovar | 338 | |||
| Turnout | 4,139 | 38.4 | |||
| Conservative hold | Swing | ||||
| Conservative hold | Swing | ||||
| Conservative hold | Swing | ||||
Hadley
| Party | Candidate | Votes | % | ± | |
|---|---|---|---|---|---|
| Conservative | Katia David | 2,674 | |||
| Conservative | Hazel E. Mammatt | 2,654 | |||
| Conservative | Kantilal S. Patel | 2,456 | |||
| Labour | Michael B. Campbell | 1,984 | |||
| Labour | Marianne Haylett | 1,791 | |||
| Labour | Lawrence E. Williams | 1,746 | |||
| Liberal Democrat | Ronald Marsh | 785 | |||
| Liberal Democrat | David A. Nowell | 725 | |||
| Liberal Democrat | Brigid M. Povah | 594 | |||
| Green | Timothy Riley | 408 | |||
| Turnout | 5,611 | 39.5 | |||
| Conservative hold | Swing | ||||
| Conservative hold | Swing | ||||
| Conservative hold | Swing | ||||
Hale
| Party | Candidate | Votes | % | ± | |
|---|---|---|---|---|---|
| Labour | Steven E. Blomer | 1,523 | |||
| Labour | Ruth J. Nyman | 1,498 | |||
| Conservative | Brian C. Gordon | 1,393 | |||
| Labour | Julian E. Stern | 1,379 | |||
| Conservative | Michael Slipman | 1,253 | |||
| Conservative | Prafulla C. Patel | 1,201 | |||
| Liberal Democrat | James M. Creighton | 658 | |||
| Liberal Democrat | Geoffrey A. Jacobs | 557 | |||
| Liberal Democrat | Jeremy R. Pattison | 532 | |||
| Turnout | 3,655 | 34.8 | |||
| Labour hold | Swing | ||||
| Labour gain from Conservative | Swing | ||||
| Conservative hold | Swing | ||||
Hendon
| Party | Candidate | Votes | % | ± | |
|---|---|---|---|---|---|
| Conservative | Anthony H. Finn | 1,487 | |||
| Conservative | Maureen Braun | 1,349 | |||
| Conservative | Andrew M. Sherling | 1,293 | |||
| Liberal Democrat | Susan J. Palin | 1,226 | |||
| Liberal Democrat | Jonathan M. Davies | 1,164 | |||
| Labour | Aubrey E. Ross | 1,105 | |||
| Labour | Francis Deutsch | 1,022 | |||
| Liberal Democrat | Sean J. Hooker | 977 | |||
| Labour | Margaret C. Onokah | 912 | |||
| Green | Georgia Theodorou | 200 | |||
| Turnout | 3,867 | 31.5 | |||
| Conservative hold | Swing | ||||
| Conservative hold | Swing | ||||
| Conservative hold | Swing | ||||
Mill Hill
| Party | Candidate | Votes | % | ± | |
|---|---|---|---|---|---|
| Liberal Democrat | Wayne J. Casey | 2,469 | |||
| Liberal Democrat | Roger L. Axworthy | 2,348 | |||
| Liberal Democrat | Jeremy E. Davies | 2,339 | |||
| Conservative | Mary P. Gallagher | 1,083 | |||
| Conservative | Richard W. J. Martyn | 1,053 | |||
| Conservative | Leslie J. Pym | 1,040 | |||
| Labour | William J. Parnaby | 652 | |||
| Labour | Pijushkanti Bhattacharyya | 622 | |||
| Labour | Mohan R. Samarasinhe | 535 | |||
| Green | Gillian L. Dunne | 152 | |||
| Turnout | 4,289 | 37.2 | |||
| Liberal Democrat hold | Swing | ||||
| Liberal Democrat hold | Swing | ||||
| Liberal Democrat hold | Swing | ||||
St Paul's
| Party | Candidate | Votes | % | ± | |
|---|---|---|---|---|---|
| Labour | Kitty Lyons | 2,332 | |||
| Labour | Katherine M. McGuirk | 2,214 | |||
| Labour | James B. Tierney | 2,182 | |||
| Conservative | Mary Phillips | 1,427 | |||
| Conservative | Ida Westbrook | 1,359 | |||
| Conservative | Jonathan Z. Shrank | 1,308 | |||
| Liberal Democrat | Joan S. Beales | 421 | |||
| Liberal Democrat | Hugh S. L'Estrange | 362 | |||
| Green | Edelgard Vaswani | 343 | |||
| Liberal Democrat | lngeborg Graber | 336 | |||
| Turnout | 4,423 | 41.2 | |||
| Labour hold | Swing | ||||
| Labour hold | Swing | ||||
| Labour hold | Swing | ||||
Totteridge
| Party | Candidate | Votes | % | ± | |
|---|---|---|---|---|---|
| Conservative | Victor Lyon | 2,472 | |||
| Conservative | Brian J. Coleman | 2,457 | |||
| Conservative | Kevin D. Edson | 2,415 | |||
| Labour | Katherine Rounce | 1,273 | |||
| Labour | Michael A. J. O'Donnell | 1,246 | |||
| Labour | Victoria M. Spawls | 1,171 | |||
| Liberal Democrat | Irene Brewer | 518 | |||
| Liberal Democrat | Anthony D. Wildsmith | 450 | |||
| Liberal Democrat | Gavin A. Jordan | 439 | |||
| Green | Joy H. Boustred | 268 | |||
| Natural Law | Diane Derksen | 41 | |||
| Turnout | 4,483 | 38.6 | |||
| Conservative hold | Swing | ||||
| Conservative hold | Swing | ||||
| Conservative hold | Swing | ||||
West Hendon
| Party | Candidate | Votes | % | ± | |
|---|---|---|---|---|---|
| Labour | Agnes C. Siocombe | 1,408 | |||
| Labour | Arun C. Ghosh | 1,407 | |||
| Labour | Ansuya V. Sodha | 1,215 | |||
| Conservative | James G. Fluss | 979 | |||
| Conservative | Angela Shine | 978 | |||
| Conservative | Rene A. Braun | 954 | |||
| Liberal Democrat | Richard J. Coward | 344 | |||
| Liberal Democrat | Mary Dodd | 302 | |||
| Liberal Democrat | Shirley J. Rodwell | 299 | |||
| Green | Christine Antoniou | 171 | |||
| Turnout | 3,057 | 28.6 | |||
| Labour hold | Swing | ||||
| Labour hold | Swing | ||||
| Labour hold | Swing | ||||
Woodhouse
| Party | Candidate | Votes | % | ± | |
|---|---|---|---|---|---|
| Labour | Stanley J. Cross | 2,521 | |||
| Labour | Beverley A. Pearce | 2,358 | |||
| Labour | Barry J. Rawlings | 2,288 | |||
| Conservative | Mary E. J. M. Russell | 1,236 | |||
| Conservative | Roy Treeby | 1,209 | |||
| Conservative | Peter Yallouros | 1,160 | |||
| Green | Solomon O. Natelson | 435 | |||
| Liberal Democrat | David H. Ive | 413 | |||
| Liberal Democrat | Barrie R. Manson | 407 | |||
| Liberal Democrat | Joy R. Manson | 407 | |||
| Turnout | 4,555 | 37.5 | |||
| Labour hold | Swing | ||||
| Labour hold | Swing | ||||
| Labour hold | Swing | ||||
By-elections between 1998 and 2002
Woodhouse
| Party | Candidate | Votes | % | ± | |
|---|---|---|---|---|---|
| Labour | Paul G. Rogers | 1,481 | 49.4 | -5.3 | |
| Conservative | Roy Treeby | 1,098 | 36.6 | +9.8 | |
| Green | Solomon O. Natelson | 234 | 7.8 | -1.6 | |
| Liberal Democrat | Sean J. Hooker | 184 | 6.1 | -2.8 | |
| Majority | 383 | 12.8 | |||
| Turnout | 2,997 | 24.6 | |||
| Labour hold | Swing | ||||
The by-election was called following the resignation of Cllr. Stanley J. Cross.
Garden Suburb
| Party | Candidate | Votes | % | ± | |
|---|---|---|---|---|---|
| Conservative | Vanessa R. Gearson | 1,162 | 47.1 | -8.7 | |
| Liberal Democrat | Marjorie A. Harris | 811 | 32.9 | +5.3 | |
| Labour | Alan Schneiderman | 427 | 17.3 | +6.1 | |
| Green | Miranda J. Dunn | 67 | 2.7 | -2.7 | |
| Majority | 351 | 14.2 | |||
| Turnout | 2,467 | 24.1 | |||
| Conservative hold | Swing | ||||
The by-election was called following the resignation of Cllr. Peter J. Skolar.
Hadley
| Party | Candidate | Votes | % | ± | |
|---|---|---|---|---|---|
| Conservative | Yvonne W. Prentice | 1,743 | 58.5 | +12.8 | |
| Labour | Anthonakis N. Vourou | 738 | 24.7 | -9.2 | |
| Liberal Democrat | David A. G. Nowell | 357 | 12.0 | -1.3 | |
| Green | Edelgard Vaswani | 144 | 2.7 | -2.7 | |
| Majority | 1,005 | 33.8 | |||
| Turnout | 2,982 | 21.0 | |||
| Conservative hold | Swing | ||||
The by-election was called following the resignation of Cllr. Hazel E. Mammatt.
Mill Hill
| Party | Candidate | Votes | % | ± | |
|---|---|---|---|---|---|
| Liberal Democrat | Sean J. Hooker | 1,496 | 54.6 | -2.1 | |
| Conservative | John R. Hart | 809 | 29.5 | +4.6 | |
| Labour | Zakia Zubairi | 385 | 14.1 | -0.9 | |
| Green | Donald E. Lyven | 49 | 1.7 | -1.7 | |
| Majority | 687 | 25.1 | |||
| Turnout | 2,739 | 24.1 | |||
| Liberal Democrat hold | Swing | ||||
The by-election was called following the resignation of Cllr. Roger L. Axworthy.
Finchley
| Party | Candidate | Votes | % | ± | |
|---|---|---|---|---|---|
| Conservative | Michael W. Freer | 1,409 | 54.0 | +8.8 | |
| Labour | Christopher P. Underwood | 862 | 33.0 | -1.9 | |
| Liberal Democrat | Karen S. Hatchett | 245 | 9.4 | -2.1 | |
| Green | Edelgard Vaswani | 95 | 3.7 | -4.8 | |
| Majority | 547 | 19.0 | |||
| Turnout | 2,611 | 24.4 | |||
| Conservative hold | Swing | ||||
The by-election was called following the death of Cllr. Barbara I. Langstone.
References
- 1 2 "Local Elections results". The Times. 1998-05-09. p. 46.
- ↑ Minors, Michael; Grenham, Dennis. "London Borough Council Elections 7 May 1998 including the Greater London Authority Referendum results" (PDF). Demographic and Statistical Studies. London Research Centre. Retrieved 21 February 2015.
- 1 2 3 4 5 "London Borough Council Elections 2 May 2002" (PDF). London Datastore. Greater London Authority. Retrieved 25 February 2015.
This article is issued from Wikipedia - version of the 7/22/2016. The text is available under the Creative Commons Attribution/Share Alike but additional terms may apply for the media files.