Cape St. Francis (electoral district)
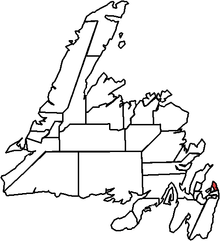
 Cape St. Francis in relation to other district in Newfoundland | |||
| Provincial electoral district | |||
| Legislature | Newfoundland and Labrador House of Assembly | ||
| MHA |
| ||
| District created | 1966 | ||
| First contested | 1966 | ||
| Last contested | 2011 | ||
| Demographics | |||
| Population (2006) | 11,777 | ||
| Electors (2011) | 10,444 | ||
Cape St. Francis is a provincial electoral district for the House of Assembly of Newfoundland and Labrador, Canada.
The vast majority of the district is made up of suburban communities neighbouring the provincial capital St. John's, though the district does take in the northeast end of the city. The majority of residents commute into St. John's daily for work. The district was known for many years as St. John's East-Extern.
The district's boundaries encompass the northeastern tip of Avalon Peninsula, including the outer stretches of St. John's as well as Bauline, Flatrock, Logy Bay-Middle Cove-Outer Cove, Pouch Cove and Torbay. In 2011, 10,444 people were eligible to vote within the district.[1]
The district has been a Progressive Conservative stronghold for over 40 years.
Members of the House of Assembly
The district has elected the following Members of the House of Assembly:
| Member | Party | Term | |
|---|---|---|---|
| Kevin Parsons | Progressive Conservative | 2008–present | |
| Jack Byrne | Progressive Conservative | 1993-2008 | |
| Kevin Parsons Sr. | Progressive Conservative | 1986-1993 | |
| Tom Hickey | Progressive Conservative | 1966-1986 | |
Election results
| Newfoundland and Labrador general election, 2015 | ||||||||
|---|---|---|---|---|---|---|---|---|
| Party | Candidate | Votes | % | ∆% | ||||
| Progressive Conservative | Kevin Parsons | 4,086 | 66.34 | +6.96 | ||||
| Liberal | Geoff Gallant | 1,613 | 26.19 | +23.26 | ||||
| New Democratic | Mark Gruchy | 460 | 7.47 | 30.22 | ||||
| Total valid votes | 6,159 | 100.00 | ||||||
| Newfoundland and Labrador general election, 2011 | ||||||||
|---|---|---|---|---|---|---|---|---|
| Party | Candidate | Votes | % | ∆% | ||||
| Progressive Conservative | Kevin Parsons | 4,132 | 59.38 | -9.59 | ||||
| New Democratic | Geoff Gallant | 2,623 | 37.69 | +14.29 | ||||
| Liberal | Joy Buckle | 204 | 2.93 | -4.70 | ||||
| Total valid votes | 6,959 | 99.47 | ||||||
| Total rejected ballots | 37 | 0.53 | ||||||
| Turnout | 6,996 | 65.53 | ||||||
| Electors on the lists | 10,676 | – | ||||||
| Newfoundland and Labrador provincial by-election, August 27, 2008 | ||||||||
|---|---|---|---|---|---|---|---|---|
| Party | Candidate | Votes | % | ∆% | ||||
| Progressive Conservative | Kevin Parsons | 2,865 | 68.97 | -8.86 | ||||
| New Democratic | Kathleen Connors | 972 | 23.40 | +12.78 | ||||
| Liberal | Tonia Power-Mercer | 317 | 7.63 | -3.91 | ||||
| Total valid votes | 4,154 | |||||||
| Newfoundland and Labrador general election, 2007 | ||||||||
|---|---|---|---|---|---|---|---|---|
| Party | Candidate | Votes | % | ∆% | ||||
| Progressive Conservative | Jack Byrne | 4,983 | 77.83 | +6.7 | ||||
| Liberal | Bill Tapper | 739 | 11.54 | -4.89 | ||||
| New Democratic | Kathleen Connors | 680 | 10.62 | -1.82 | ||||
| Total valid votes | 6,402 | 99.50 | ||||||
| Total rejected ballots | 32 | 0.50 | ||||||
| Turnout | 6,434 | 71.00 | ||||||
| Electors on the lists | 9,061 | – | ||||||
| Party | Candidate | Votes | % | ± | |
|---|---|---|---|---|---|
| Progressive Conservative | Jack Byrne | 5,604 | 71.13 | +9.47 | |
| Liberal | Bill Tapper | 1,294 | 16.43 | -15.43 | |
| NDP | Ralph Tapper | 980 | 12.44 | +5.98 | |
| Party | Candidate | Votes | % | ± | |
|---|---|---|---|---|---|
| Progressive Conservative | Jack Byrne | 4,197 | 61.66 | +10.57 | |
| Liberal | Jim Martin | 2,169 | 31.86 | -17.05 | |
| NDP | Shawn Sullivan | 440 | 6.46 | +6.46 | |
| Party | Candidate | Votes | % | ± | |
|---|---|---|---|---|---|
| Progressive Conservative | Jack Byrne | 3,299 | 51.09 | – | |
| Liberal | Jim Martin | 3,158 | 48.91 | ||
References
- ↑ "Summary of Polling Divisions CAPE ST. FRANCIS" (PDF). Elections Newfoundland and Labrador. 3 August 2011. Retrieved 2 September 2011.
- ↑ "District Profile - Cape St. Francis". Canadian Broadcasting Corporation. Retrieved 1 September 2011.