Distribution of lightning

The incidence of individual lightning strikes in any particular place is highly variable, but lightning does have an underlying spatial distribution. In 1997 NASA and National Space Development Agency (NASDA) of Japan launched the first Lightning Imaging Sensor (LIS)-equipped satellite to detect and record lightning.[1]
Lightning is now known to occur on average 44 (± 5) times a second over the entire Earth, making a total of about 1.4 billion flashes per year.[2][3]
Ratios of lightning types
The lightning flash rate averaged over the earth for intra-cloud (IC) + cloud-to-cloud (CC) to cloud-to-ground (CG) is at the ratio: (IC+CC):CG = 75:25. The base of the negative region in a cloud is normally at roughly the elevation where freezing occurs. The closer this region is to the ground, the more likely cloud-to-ground strikes are. In the tropics where the freeze zone is higher the (IC+CC):CG ratio is about 90:10. At the latitude of Norway (60° lat.) where the freezing elevation is lower the (IC+CC):CG ratio is about 50:50.[4][5]
Distribution
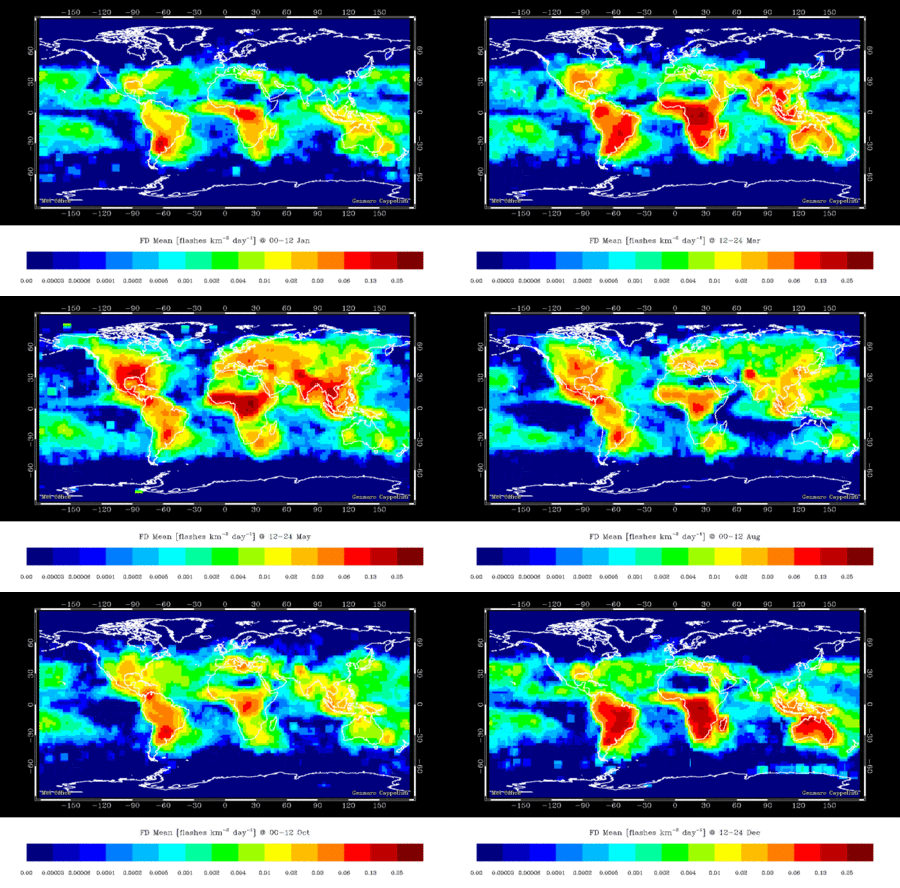
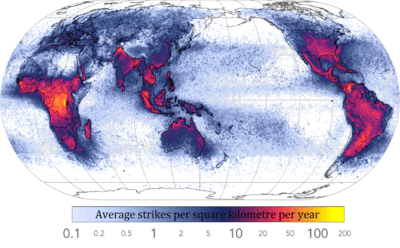
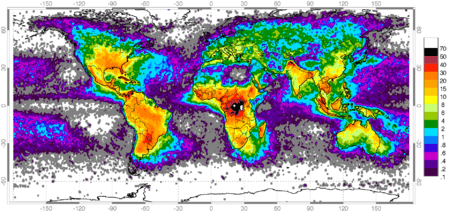
The map on the right shows that lightning is not distributed evenly around the planet.[6] About 70% of lightning occurs on land in the Tropics, where the majority of thunderstorms occur. The north and south poles and the areas over the oceans have the fewest lightning strikes. The place where lightning occurs most often (according to the data from 2004 to 2005) is near the small village of Kifuka in the mountains of eastern Democratic Republic of the Congo,[7] where the elevation is around 975 metres (3,200 ft). This region received 158 lightning strikes per 1 square kilometer (409 per sq mi) a year.[3]
Above the Catatumbo river, which feeds Lake Maracaibo in Venezuela, Catatumbo lightning flashes several times per minute and has the highest number of lightning per square kilometer in the world. Singapore has one of the highest rates of lightning activity in the world.[8] The city of Teresina in northern Brazil has the third-highest rate of occurrences of lightning strikes in the world. The surrounding region is referred to as the Chapada do Corisco ("Flash Lightning Flatlands").[9]
In the United States, the west coast has the fewest lightning strikes,[10] but Central Florida sees more lightning than any other area. Florida has the largest number of recorded strikes during summer. Much of Florida is a peninsula, bordered by the ocean on three sides. The result is the nearly daily development of clouds that produce thunderstorms. For example, in what is called "Lightning Alley", an area from Tampa to Orlando, there are as many as 50 strikes per square mile (about 20 per km2) per year.[11][12] The Empire State Building in New York City is struck by lightning on average 23 times each year, and was once struck 8 times in 24 minutes.[13]
Lightning mapping

Combined 1995–2003 data from the Optical Transient Detector and 1998–2003 data from the Lightning Imaging Sensor.
Official maps have delays in minutes (Canada,[14] USA[15]) or even hours (Europe[16]), whereas the amateur network Blitzortung has delays usually under ten seconds.[17]
Lightning all over the world is observed by the LIS satellite system. In the US lightning monitoring is done by the National Lightning Detection Network, part of NASA’s National Severe Storms Laboratory. Maps of the U.S. lightning strike/km2yr averaged from 1997-2010 are available from the National Lightning Detection Network (NLDL)--VAISALA[18] More detailed U.S. regional lightning maps based on the National Oceanic and Atmospheric Administration (NOAA) and the National Weather Service (NWS) data centered on different cities are put out by the Cooperative Institute for Applied Meteorological Studies at Texas A&M University.[19]
Electromagnetic radiation
NASA scientists have found that electromagnetic radiation created by lightning in clouds only a few miles high can create a safe zone in the Van Allen radiation belts that surround the earth. This zone, known as the "Van Allen Belt slot", may be a safe haven for satellites in medium Earth orbits (MEOs), protecting them from the Sun's intense radiation.[20][21][22]
References
- ↑ Lightning Imaging Sensor satellite and data Accessed 15 Jul 2012
- ↑ John E. Oliver (2005). Encyclopedia of World Climatology. National Oceanic and Atmospheric Administration. ISBN 978-1-4020-3264-6. Retrieved February 8, 2009.
- 1 2 "Annual Lightning Flash Rate". National Oceanic and Atmospheric Administration. Retrieved January 15, 2013.
- ↑ "Where LightningStrikes". NASA Science. Science News. 2001-12-05. Retrieved July 5, 2010.
- ↑ Uman, Martin A.' "All About Lightning"; Ch. 8; p. 68, Dover Publications N.Y.; 1986; ISBN 9780486252377
- ↑ P.R. Field; W.H. Hand; G. Cappelluti; et al. (November 2010). "Hail Threat Standardisation" (PDF). European Aviation Safety Agency. RP EASA.2008/5.
- ↑ "Kifuka – place where lightning strikes most often". Wondermondo. Retrieved November 21, 2010.
- ↑ National Environmental Agency (2002). "Lightning Activity in Singapore". National Environmental Agency. Retrieved September 24, 2007.
- ↑ Paesi Online. "Teresina: Vacations and Tourism". Paesi Online. Retrieved September 24, 2007.
- ↑ Map of lightning strikes Accessed 11 Jul 2012
- ↑ NASA (2007). "Staying Safe in Lightning Alley". NASA. Retrieved September 24, 2007.
- ↑ Kevin Pierce (2000). "Summer Lightning Ahead". Florida Environment.com. Retrieved September 24, 2007.
- ↑ Uman, Martin A.' "All About Lightning"; Ch. 6, p. 47, Dover Publications N.Y.; 1986; ISBN 9780486252377
- ↑ Canadian real time lightning detection Accessed 15 Jul 2012
- ↑ Lightning Detection Network Accessed 15 Jul 2012
- ↑ European lightning maps (EUCLID) Accessed 15 Jul 2012
- ↑ "Blitzortung.org". Retrieved August 4, 2012.
- ↑ VAISALA US lightning strike density map Accessed 28 Jul 2012
- ↑ U.S. regional lightning strike maps Accessed 30 Jul 2012
- ↑ NASA (2005). "Flashes in the Sky: Lightning Zaps Space Radiation Surrounding Earth". NASA. Retrieved September 24, 2007.
- ↑ Robert Roy Britt (1999). "Lightning Interacts with Space, Electrons Rain Down". Space.com. Archived from the original on August 12, 2010. Retrieved September 24, 2007.
- ↑ Demirkol, M. K.; Inan, Umran S.; Bell, T.F.; Kanekal, S.G.; Wilkinson, D.C. (1999). "Ionospheric effects of relativistic electron enhancement events". Geophysical Research Letters. 26 (23): 3557–3560. Bibcode:1999GeoRL..26.3557D. doi:10.1029/1999GL010686.
