Gantt chart

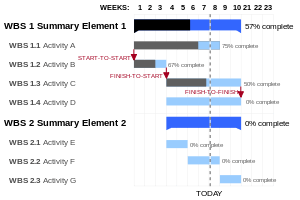
A Gantt chart is a type of bar chart, devised by Henry Gantt in the 1910s, that illustrates a project schedule. Gantt charts illustrate the start and finish dates of the terminal elements and summary elements of a project. Terminal elements and summary elements comprise the work breakdown structure of the project. Modern Gantt charts also show the dependency (i.e., precedence network) relationships between activities. Gantt charts can be used to show current schedule status using percent-complete shadings and a vertical "TODAY" line as shown here.
Although now regarded as a common charting technique, Gantt charts were considered revolutionary when first introduced.[1] This chart is also used in information technology to represent data that has been collected.
Historical development
The first known tool of this type was developed in 1896 by Karol Adamiecki, who called it a harmonogram.[2] Adamiecki did not publish his chart until 1931, however, and only in Polish, which limited both its adoption and recognition of his authorship. The chart is named after Henry Gantt (1861–1919), who designed his chart around the years 1910–1915.[3][4]
One of the first major applications of Gantt charts was by the United States during World War I, at the instigation of General William Crozier.[5]
In the 1980s, personal computers allowed for widespread creation of complex and elaborate Gantt charts. The first desktop applications were intended mainly for project managers and project schedulers. With the advent of the Internet and increased collaboration over networks at the end of the 1990s, Gantt charts became a common feature of web-based applications, including collaborative groupware.
Example
In the following table there are seven tasks, labeled A through G. Some tasks can be done concurrently (A and B) while others cannot be done until their predecessor task is complete (C and D cannot begin until A is complete). Additionally, each task has three time estimates: the optimistic time estimate (O), the most likely or normal time estimate (M), and the pessimistic time estimate (P). The expected time (TE) is estimated using the beta probability distribution for the time estimates, using the formula (O + 4M + P) ÷ 6.
| Activity | Predecessor | Time estimates | Expected time | ||
|---|---|---|---|---|---|
| Opt. (O) | Normal (M) | Pess. (P) | |||
| A | — | 2 | 4 | 6 | 4.00 |
| B | — | 3 | 5 | 9 | 5.33 |
| C | A | 4 | 5 | 7 | 5.17 |
| D | A | 4 | 6 | 10 | 6.33 |
| E | B, C | 4 | 5 | 7 | 5.17 |
| F | D | 3 | 4 | 8 | 4.50 |
| G | E | 3 | 5 | 8 | 5.17 |
Once this step is complete, one can draw a Gantt chart or a network diagram.
Further applications
Gantt charts can be used for scheduling generic resources as well as for their use in project management. They can also be used for scheduling production processes and employee rostering.[6] In the latter context, they may also be known as timebar schedules. Gantt charts can be used to track shifts or tasks and also vacations or other types of out-of-office time.[7] Specialized employee scheduling software may output schedules as a Gantt chart, or they may be created through popular desktop publishing software.
See also
- Critical path method
- Float (project management)
- Henry Gantt
- List of project management software, which includes specific Gantt Chart software.
- Program Evaluation and Review Technique (PERT)
References
- ↑ Wilson, James M. (1 September 2003). "Gantt charts: A centenary appreciation" (PDF). European Journal of Operational Research. 149 (2). doi:10.1016/S0377-2217(02)00769-5. Retrieved 2013-07-28.
- ↑ "The Harmonogram of Karol Adamiecki – Tags: ADAMIECKI, Karol ORGANIZATION charts". Connection.ebscohost.com. Retrieved 2014-06-04.
- ↑ H.L. Gantt, Work, Wages and Profit, published by the Engineering Magazine, New York, 1910; republished as Work, Wages and Profits, Easton, Pennsylvania, Hive Publishing Company, 1974, ISBN 0-87960-048-9.
- ↑ Peter W. G. Morris, The Management of Projects, Thomas Telford, 1994, ISBN 0-7277-2593-9, Google Print, p.18
- ↑ Wallace Clark and Henry Gantt (1922) The Gantt chart, a working tool of management. New York, Ronald Press.
- ↑ Triant G. Flouris; Dennis Lock (2009). Managing Aviation Projects from Concept to Completion. Ashgate Publishing, Ltd. pp. 207–. ISBN 978-0-7546-7615-7.
- ↑ "Availability Planning". CEITON. Retrieved 2014-06-04.
External links
| Wikimedia Commons has media related to Gantt charts. |
| Look up gantt chart in Wiktionary, the free dictionary. |
- Long-running discussion regarding limitations of the Gantt chart format, and alternatives, on Edward Tufte's website
