Harvey Balls
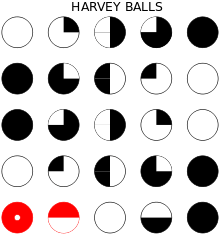
Harvey Balls are round ideograms used for visual communication of qualitative information. They are commonly used in comparison tables to indicate the degree to which a particular item meets a particular criterion.
![]()
For example, in a comparison of products, information such as price or weight can be conveyed numerically, and binary information such as the existence or lack of a feature can be conveyed with a check mark; however, information such as "quality" or "safety" or "taste" is often difficult to summarize in a manner allowing easy comparison – thus, Harvey Balls are used.
In addition to their use in qualitative comparison, Harvey Balls are also commonly used in Project Management for project tracking; in Lean Manufacturing for VSM and Continuous Improvement tracking; and in BPM software for visualisation.[1]
Harvey Poppel is generally credited with inventing Harvey Balls in the 1970s while working at Booz Allen Hamilton as a consultant.[2][3]
Harvey Balls have nothing to do with Harvey Ball, the inventor of the smiley face.
Implementations and support
SVG

The use of SVG to render Harvey Balls allows them to be easily used in web browsers and applications that support the XML vector graphics format. The benefit is that no special font is required and the Harvey Balls can be displayed using an open format. The main drawback is that SVG is not universally supported.
Microsoft Excel
Microsoft Excel 2007 introduced the functionality to render Harvey Balls through the Conditional Formatting function.
Microsoft Word and PowerPoint
While using Microsoft Word or Microsoft PowerPoint 2007 there are two ways to insert Harvey Balls in text.
- On the Insert Tab - Click Symbol - On the dialogue box select font as Arial Unicode MS and Subset as Geometric Shapes and insert the relevant Symbol.
- Type the Unicode of the character you plan to insert (Ex. U + 25D3), Press 'Alt + X'. For a list of Unicodes, refer here.
Custom font
Custom fonts have been developed such that the numbers 0-9 map to a particular Harvey Ball. Incorporating the Harvey Ball into a document then becomes a matter of selecting the number which corresponds to the desired Harvey Ball and setting the font to Harvey Ball. The Harvey Balls can then be manipulated like any other font (e.g., color, size, underline) and may be easier to use than other implementations. The main drawback of this approach is that the font either needs to be embedded in the document or all the viewers of the document must have the font installed.
Unicode
The use of Unicode to render Harvey Balls depends on whether a font with these characters is installed; the Unicode Harvey Balls may be difficult to work with in software that does not render these characters uniformly.
The Unicode set of related symbols includes:
| Symbol | Unicode Codepoint (Hex) | Alt code | Name |
|---|---|---|---|
| ○ | U+25CB | 9675 | Large Circle |
| ● | U+25CF | 9679 | Black Circle |
| ◐ | U+25D0 | 9680 | Circle with left half black |
| ◑ | U+25D1 | 9681 | Circle with right half black |
| ◒ | U+25D2 | 9682 | Circle with lower half black |
| ◓ | U+25D3 | 9683 | Circle with upper half black |
| ◔ | U+25D4 | 9684 | Circle with upper right quadrant black |
| ◕ | U+25D5 | 9685 | Circle with all but upper left quadrant black |
Modifications and other uses
Consumer Reports uses a modified type of Harvey Ball in product ratings and has even incorporated one into its logo.[4]
IBM uses a modified version in its Lotus Notes product as recipient icons to show whether the recipient of a piece of mail is the sole recipient, a copied recipient, etc.[5]
Some of the symbols used for Harvey Balls are also used in other fields to represent other types of information:[6]
| Symbol | Uses |
|---|---|
| ○ | Astronomy: (Full Moon) |
| ● | Astronomy: (New Moon) |
| ◐ | Astronomy: (First Quarter Moon) |
| ◑ | Astronomy: (Last Quarter Moon), Electronics: (On/Off Switch, Television Contrast) |
| ◒ | Cartography: (Spring or Well) |
| ◓ | Meteorology: (Partly overcast) |
| ◔ | Meteorology: (Almost clear sky or Somewhat overcast) |
| ◕ | Meteorology: (Broken Clouds)[7] |
See also
- Radar graph, also used for comparisons
- Okta, similar symbols used in meteorology
References
- ↑ kellen.net - Business Performance Measurement - At the Crossroads of Strategy, Decision-Making, Learning and Information Visualization
- ↑ Digital Roam - The Back of the Napkin Blog
- ↑ Palm Beach Daily News
- ↑ Consumer Reports
- ↑ IBM DeveloperWorks Blog
- ↑ Symbols.com - Online Encyclopedia of Western Signs and Ideograms
- ↑ Okta - Weather Icons