List of metropolitan areas of Kentucky

An enlargeable map of the 120 counties of the State of Kentucky.
The metropolitan areas of the State of Kentucky include the urban statistical areas defined by the United States Office of Management and Budget and regions of urban population defined by other organizations.
Metropolitan statistical areas
The following tables list population figures for the metropolitan statistical areas of Kentucky, in rank of population.
The following table describes these areas with the following information:
- The name of the county
- The population of the county as of July 1, 2009, as estimated by the United States Census Bureau[1]
- The county population as of April 1, 2000, as counted by the United States Census 2000,[1] and
- The percent county population change from April 1, 2000, to July 1, 2009, as estimated by the United States Census Bureau.[1]

Bowling Green, third largest city and metropolitan area
Bowling Green, KY MSA
| County | 2009 Pop | 2000 Pop | Change |
|---|---|---|---|
| Edmonson County, Kentucky | 11,926 | 11,644 | +2.42% |
| Warren County, Kentucky | 108,669 | 92,552 | +17.41% |
| Total | 120,595 | 104,166 | +15.77% |
Cincinnati-Middletown, OH-KY-IN MSA
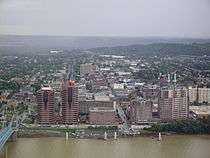
Covington
| County | 2009 Pop | 2000 Pop | Change |
|---|---|---|---|
| Hamilton County, Ohio[3] | 855,062 | 845,303 | +1.15% |
| Butler County, Ohio | 363,184 | 332,807 | +9.13% |
| Warren County, Ohio | 210,712 | 158,383 | +33.04% |
| Clermont County, Ohio | 196,364 | 177,977 | +10.33% |
| Kenton County, Kentucky | 158,729 | 151,464 | +4.80% |
| Boone County, Kentucky | 118,576 | 85,991 | +37.89% |
| Campbell County, Kentucky | 88,423 | 88,616 | −0.22% |
| Dearborn County, Indiana | 50,502 | 46,109 | +9.53% |
| Brown County, Ohio | 44,003 | 42,285 | +4.06% |
| Grant County, Kentucky | 25,542 | 22,384 | +14.11% |
| Franklin County, Indiana | 23,148 | 22,151 | +4.50% |
| Pendleton County, Kentucky | 14,887 | 14,390 | +3.45% |
| Bracken County, Kentucky | 8,653 | 8,279 | +4.52% |
| Gallatin County, Kentucky | 8,202 | 7,870 | +4.22% |
| Ohio County, Indiana | 5,909 | 5,623 | +5.09% |
| Kentucky Total | 423,012 | 378,994 | +11.61% |
| Total | 2,171,896 | 2,009,632 | +8.07% |
Clarksville-Hopkinsville, TN-KY MSA
| County | 2009 Pop | 2000 Pop | Change |
|---|---|---|---|
| Montgomery County, Tennessee | 160,978 | 134,768 | +19.45% |
| Christian County, Kentucky | 80,938 | 72,265 | +12.00% |
| Trigg County, Kentucky | 13,290 | 12,597 | +5.50% |
| Stewart County, Tennessee | 13,340 | 12,370 | +7.84% |
| Kentucky Total | 94,228 | 84,862 | +11.04% |
| Total | 268,546 | 232,000 | +15.75% |
Elizabethtown, KY MSA
| County | 2009 Pop | 2000 Pop | Change |
|---|---|---|---|
| Hardin County, Kentucky | 99,770 | 94,174 | +5.94% |
| LaRue County, Kentucky | 13,663 | 13,373 | +2.17% |
| Total | 113,443 | 107,547 | +5.48% |
Evansville, IN-KY MSA
| County | 2009 Pop | 2000 Pop | Change |
|---|---|---|---|
| Vanderburgh County, Indiana | 175,434 | 171,922 | +2.04% |
| Warrick County, Indiana | 58,521 | 52,383 | +11.72% |
| Henderson County, Kentucky | 45,496 | 44,829 | +1.49% |
| Gibson County, Indiana | 32,750 | 32,500 | +0.77% |
| Posey County, Indiana | 26,004 | 27,061 | −3.91% |
| Webster County, Kentucky | 13,706 | 14,120 | −2.93% |
| Kentucky Total | 59,202 | 58,949 | +0.43% |
| Total | 351,911 | 342,815 | +2.65% |
Huntington-Ashland, WV-KY-OH MSA

| County | 2009 Pop | 2000 Pop | Change |
|---|---|---|---|
| Cabell County, West Virginia | 95,214 | 96,784 | −1.62% |
| Lawrence County, Ohio | 62,774 | 62,319 | +0.73% |
| Boyd County, Kentucky | 48,527 | 49,752 | −2.46% |
| Wayne County, West Virginia | 41,119 | 42,903 | −4.16% |
| Greenup County, Kentucky | 38,020 | 36,891 | +3.06% |
| Kentucky Total | 86,549 | 86,643 | −0.11% |
| Total | 285,624 | 288,649 | −1.05% |
Lexington-Fayette, KY MSA

Lexington, second largest city and metropolitan area
| County | 2009 Pop | 2000 Pop | Change |
|---|---|---|---|
| Fayette County, Kentucky | 296,545 | 260,512 | +13.83% |
| Jessamine County, Kentucky | 47,589 | 39,041 | +21.89% |
| Scott County, Kentucky | 45,841 | 33,061 | +38.66% |
| Clark County, Kentucky | 36,159 | 33,061 | +9.37% |
| Woodford County, Kentucky | 24,986 | 23,208 | +7.66% |
| Bourbon County, Kentucky | 19,729 | 19,360 | +1.91% |
| Total | 470,849 | 408,326 | +15.31% |
Louisville-Jefferson County, KY-IN MSA

Louisville, largest city and metropolitan area
| County | 2009 Pop | 2000 Pop | Change |
|---|---|---|---|
| Jefferson County, Kentucky | 721,594 | 693,604 | +4.04% |
| Clark County, Indiana | 108,634 | 96,472 | +12.61% |
| Bullitt County, Kentucky | 75,653 | 61,236 | +23.54% |
| Floyd County, Indiana | 74,426 | 70,823 | +5.09% |
| Oldham County, Kentucky | 58,095 | 46,178 | +25.81% |
| Nelson County, Kentucky | 43,550 | 37,477 | +16.20% |
| Shelby County, Kentucky | 42,078 | 33,337 | +26.22% |
| Harrison County, Indiana | 37,562 | 34,325 | +9.43% |
| Washington County, Indiana | 27,729 | 27,223 | +1.86% |
| Meade County, Kentucky | 26,501 | 26,349 | +0.58% |
| Spencer County, Kentucky | 17,737 | 11,766 | +50.75% |
| Henry County, Kentucky | 16,060 | 15,060 | +6.64% |
| Trimble County, Kentucky | 8,958 | 8,125 | +10.25% |
| Kentucky Total | 1,010,226 | 933,132 | +8.26% |
| Total | 1,258,577 | 1,161,975 | +8.31% |
Owensboro, KY MSA

| County | 2009 Pop | 2000 Pop | Change |
|---|---|---|---|
| Daviess County, Kentucky | 95,394 | 91,545 | +4.20% |
| McLean County, Kentucky | 9,607 | 9,938 | −3.33% |
| Hancock County, Kentucky | 8,635 | 8,392 | +2.90% |
| Total | 113,636 | 109,875 | +3.42% |
References
- 1 2 3 "Annual County Population Estimates and Estimated Components of Change: April 1, 2000 to July 1, 2009" (CSV). 2009 Population Estimates. United States Census Bureau, Population Division. March 23, 2010. Retrieved March 26, 2010.
- 1 2 3 4 5 6 7 8 9 2009 Population Estimates for Kentucky's MSAs 2009 Population Estimates. United States Census Bureau, Population Division. March 23, 2010. Retrieved 2010-12-07
- ↑ An out of state area is displayed in orange
See also

This article is issued from Wikipedia - version of the 7/11/2016. The text is available under the Creative Commons Attribution/Share Alike but additional terms may apply for the media files.