Iowa's 3rd congressional district
Iowa's 3rd congressional district is a congressional district in the U.S. state of Iowa that covers the southwest portion of the state, roughly an area including Des Moines to the Nebraska and Missouri borders.
From 2003 to 2013 it encompassed Des Moines (on the western end) to the western outskirts of the Cedar Falls-Waterloo Metropolitan Area (on the northeastern end) to the western outskirts of the Cedar Rapids area (on the eastern end) and to Lucas and Monroe counties (on the southern end).
The district is represented by Republican David Young.
Redistricting
On June 22, 2001, the Iowa Legislature passed a plan to redistrict the state of Iowa. The plan went into effect in 2002 for the 108th U.S. Congress. The prior redistricting plan was effective from 1992-2001.[3]
List of representatives
| Representative |
Party |
Term |
District Residence |
Note |
| District created |
March 4, 1863 |
|
 William B. Allison William B. Allison |
Republican |
March 4, 1863 – March 3, 1871 |
|
|
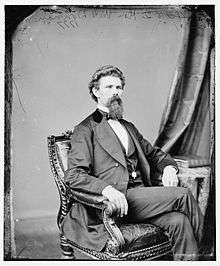 William G. Donnan William G. Donnan |
Republican |
March 4, 1871 – March 3, 1875 |
|
|
 Lucien L. Ainsworth Lucien L. Ainsworth |
Democratic |
March 4, 1875 – March 3, 1877 |
|
|
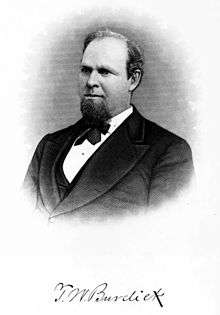 Theodore W. Burdick Theodore W. Burdick |
Republican |
March 4, 1877 – March 3, 1879 |
|
|
 Thomas Updegraff Thomas Updegraff |
Republican |
March 4, 1879 – March 3, 1883 |
|
|
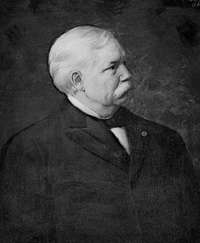 David B. Henderson David B. Henderson |
Republican |
March 4, 1883 – March 3, 1903 |
|
|
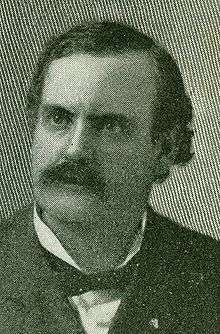 Benjamin P. Birdsall Benjamin P. Birdsall |
Republican |
March 4, 1903 – March 3, 1909 |
|
|
 Charles E. Pickett Charles E. Pickett |
Republican |
March 4, 1909 – March 3, 1913 |
|
|
 Maurice Connolly Maurice Connolly |
Democratic |
March 4, 1913 – March 3, 1915 |
|
|
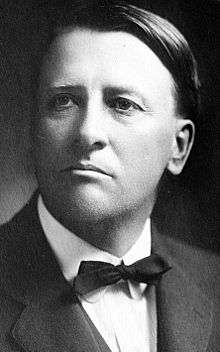 Burton E. Sweet Burton E. Sweet |
Republican |
March 4, 1915 – March 3, 1923 |
|
|
 Thomas J. B. Robinson Thomas J. B. Robinson |
Republican |
March 4, 1923 – March 3, 1933 |
|
|
 Albert C. Willford Albert C. Willford |
Democratic |
March 4, 1933 – January 3, 1935 |
|
|
 John W. Gwynne John W. Gwynne |
Republican |
January 3, 1935 – January 3, 1949 |
|
|
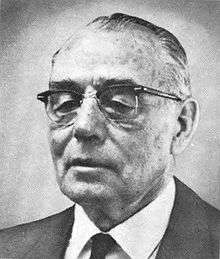 Harold R. Gross Harold R. Gross |
Republican |
January 3, 1949 – January 3, 1975 |
|
|
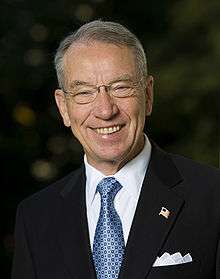 Chuck Grassley Chuck Grassley |
Republican |
January 3, 1975 – January 3, 1981 |
|
|
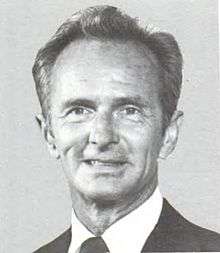 T. Cooper Evans T. Cooper Evans |
Republican |
January 3, 1981 – January 3, 1987 |
|
|
 David R. Nagle David R. Nagle |
Democratic |
January 3, 1987 – January 3, 1993 |
|
|
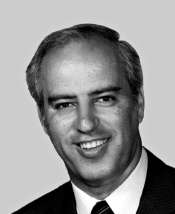 Jim R. Lightfoot Jim R. Lightfoot |
Republican |
January 3, 1993 – January 3, 1997 |
|
Redistricted from the 5th district |
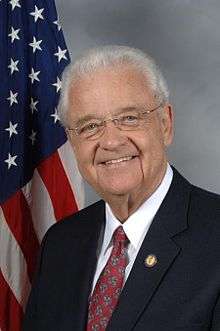 Leonard Boswell Leonard Boswell |
Democratic |
January 3, 1997 – January 3, 2013 |
|
|
 Tom Latham Tom Latham |
Republican |
January 3, 2013 – January 3, 2015 |
Clive |
Redistricted from the 4th district |
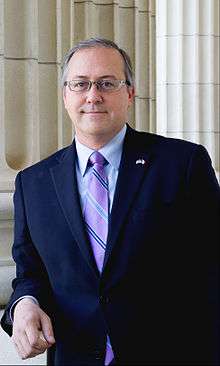 David Young David Young |
Republican |
January 3, 2015 – |
Van Meter |
|
Historical election results
| Year[4]
|
Party Affiliation |
Winner |
Number of Votes |
Party Affiliation |
Loser |
Number of Votes |
Percentage of Votes |
| 1920 |
Republican |
Burton E. Sweet |
67,859 |
Farmer-Labor |
Roy Jacobs |
1,974 |
97% - 3% |
| 1922 |
Republican |
Thomas J. B. Robinson |
34,518 |
Democrat |
Fred P. Hageman |
24,304 |
58% - 41% |
| 1924 |
Republican |
Thomas J. B. Robinson |
54,921 |
Democrat |
Willis N. Birdsall |
25,215 |
69% - 31% |
| 1926 |
Republican |
Thomas J. B. Robinson |
32,180 |
Democrat |
Ellis E. Wilson |
13,696 |
70% - 30% |
| 1928 |
Republican |
Thomas J. B. Robinson |
60,025 |
Democrat |
Leo. F. Tierney |
38,469 |
61% - 39% |
| 1930 |
Republican |
Thomas J. B. Robinson |
27,098 |
Democrat |
W. L. Beecher |
15,908 |
63% - 37% |
| 1932 |
Democrat |
Albert C. Willford |
48,939 |
Republican |
Thomas J. B. Robinson |
47,776 |
51% - 49% |
| 1934 |
Republican |
John W. Gwynne |
42,063 |
Democrat |
Albert C. Willford |
35,159 |
51% - 43% |
| 1936 |
Republican |
John W. Gwynne |
53,928 |
Democrat |
Albert C. Willford |
47,391 |
52% - 46% |
| 1938 |
Republican |
John W. Gwynne |
45,541 |
Democrat |
W. F. Hayes |
30,158 |
60% - 40% |
| 1940 |
Republican |
John W. Gwynne |
65,425 |
Democrat |
Ernest J. Seemann |
43,709 |
60% - 40% |
| 1942 |
Republican |
John W. Gwynne |
54,124 |
Democrat |
William D. Kearney |
35,065 |
61% - 39% |
| 1944 |
Republican |
John W. Gwynne |
74,901 |
Democrat |
William D. Kearney |
56,985 |
58% - 42% |
| 1946 |
Republican |
John W. Gwynne |
48,346 |
Democrat |
Dan J. P. Ryan |
29,661 |
62% - 38% |
| 1948 |
Republican |
H. R. Gross |
78,838 |
Democrat |
Dan J. P. Ryan |
56,002 |
58% - 41% |
| 1950 |
Republican |
H. R. Gross |
73,490 |
Democrat |
James O. Babcock |
40,786 |
64% - 36% |
| 1952 |
Republican |
H. R. Gross |
109,992 |
Democrat |
George R. Laub |
56,871 |
66% - 34% |
| 1954 |
Republican |
H. R. Gross |
68,307 |
Democrat |
George R. Laub |
41,622 |
62% - 38% |
| 1956 |
Republican |
H. R. Gross |
97,590 |
Democrat |
Michael Micich |
69,076 |
59% - 41% |
| 1958 |
Republican |
H. R. Gross |
61,920 |
Democrat |
Michael Micich |
53,467 |
54% - 46% |
| 1960 |
Republican |
H. R. Gross |
99,046 |
Democrat |
Edward J. Gallagher, Jr. |
76,837 |
56% - 44% |
| 1962 |
Republican |
H. R. Gross |
66,337 |
Democrat |
Neel F. Hill |
50,580 |
57% - 43% |
| 1964 |
Republican |
H. R. Gross |
83,455 |
Democrat |
Stephen M. Peterson |
83,036 |
50.1% - 49.9% |
| 1966 |
Republican |
H. R. Gross |
79,343 |
Democrat |
L. A. Pat Touchae |
48,530 |
62% - 38% |
| 1968 |
Republican |
H. R. Gross |
101,839 |
Democrat |
John E. Van Eschen |
57,164 |
64% - 36% |
| 1970 |
Republican |
H. R. Gross |
66,087 |
Democrat |
Lyle D. Taylor |
45,958 |
59% - 41% |
| 1972 |
Republican |
H. R. Gross |
109,113 |
Democrat |
Lyle D. Taylor |
86,848 |
56% - 44% |
| 1974 |
Republican |
Charles E. Grassley |
77,468 |
Democrat |
Stephen J. Rapp |
74,859 |
51% - 49% |
| 1976 |
Republican |
Charles E. Grassley |
117,957 |
Democrat |
Stephen J. Rapp |
90,981 |
56% - 44% |
| 1978 |
Republican |
Charles E. Grassley |
103,659 |
Democrat |
John Knudson |
34,880 |
75% - 25% |
| 1980 |
Republican |
Cooper Evans |
107,869 |
Democrat |
Lynn G. Cutler |
101,735 |
51% - 48% |
| 1982 |
Republican |
Cooper Evans |
104,072 |
Democrat |
Lynn G. Cutler |
83,581 |
55% - 45% |
| 1984 |
Republican |
Cooper Evans |
133,737 |
Democrat |
Joe Johnston |
86,574 |
61% - 39% |
| 1986 |
Democrat |
David R. Nagle |
83,504 |
Republican |
John McIntee |
69,386 |
55% - 45% |
| 1988 |
Democrat |
David R. Nagle |
129,204 |
Republican |
Donald B. Redfern |
74,682 |
63% - 37% |
| 1990 |
Democrat |
David R. Nagle |
100,947 |
N/A |
No Opponent |
833 |
99% - 1% |
| 1992 |
Republican |
Jim Ross Lightfootf |
125,931 |
Democrat |
Elaine Baxter |
121,063 |
49% - 47% |
| 1994 |
Republican |
Jim Ross Lightfoot |
111,862 |
Democrat |
Elaine Baxter |
79,310 |
58% - 41% |
| 1996 |
Democrat |
Leonard L. Boswell |
115,914 |
Republican |
Mike Mahaffey |
111,895 |
49% - 48% |
| 1998 |
Democrat |
Leonard L. Boswell |
107,947 |
Republican |
Larry McKibben |
78,063 |
57% - 41% |
| 2000 |
Democrat |
Leonard L. Boswell |
156,327 |
Republican |
Jay Marcus |
83,810 |
63% - 34% |
| 2002 |
Democrat |
Leonard L. Boswell |
115,367 |
Republican |
Stan Thompson |
97,285 |
53% - 45% |
| 2004 |
Democrat |
Leonard L. Boswell |
168,007 |
Republican |
Stan Thompson |
136,099 |
55% - 45% |
| 2006 |
Democrat |
Leonard L. Boswell |
114,689 |
Republican |
Jeff Lamberti |
103,182 |
52% - 47% |
| 2008 |
Democrat |
Leonard L. Boswell |
175,423 |
Republican |
Kim Schmett |
131,524 |
56% - 42% |
| 2010 |
Democrat |
Leonard L. Boswell |
122,147 |
Republican |
Brad Zaun |
111,925 |
50% - 46% |
| 2012 |
Republican |
Tom Latham |
202,000 |
Democrat |
Leonard L. Boswell |
168,632 |
51% - 42% |
Recent election results
2002
2004
Iowa's 3rd Congressional District Election (2004)
| Party |
Candidate |
Votes |
% |
|
Democratic |
Leonard Boswell* |
168,007 |
55.21 |
|
Republican |
Stan Thompson |
136,009 |
44.72 |
|
No party |
Others |
213 |
0.07% |
| Total votes |
304,229 |
100.00 |
| Voter turnout |
% |
|
Democratic hold |
2006
2008
2010
2012
As of May 2015, five former members of the U.S. House of Representatives from Iowa's 3rd congressional district are alive.
Historical district boundaries
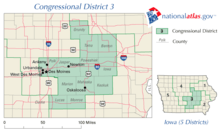 2003 - 2013
See also
References
Coordinates: 41°12′34″N 94°38′25″W / 41.20944°N 94.64028°W / 41.20944; -94.64028
.tif.png)
 William B. Allison
 William G. Donnan
 Lucien L. Ainsworth
 Theodore W. Burdick
 Thomas Updegraff
 David B. Henderson
 Benjamin P. Birdsall
 Charles E. Pickett
 Maurice Connolly
 Burton E. Sweet
 Thomas J. B. Robinson
 Albert C. Willford
 John W. Gwynne
 Harold R. Gross
 Chuck Grassley
 T. Cooper Evans
 David R. Nagle
 Jim R. Lightfoot
 Leonard Boswell
 Tom Latham
 David Young