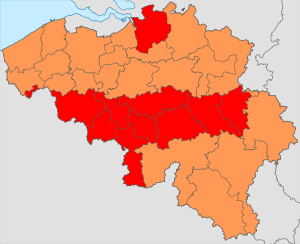
Belgian general election, 1968
| | |||||||
| |||||||
| |||||||
|
| |||||||
| Colours denote the winning party in each electoral district (for the Chamber of Deputies). | |||||||
 |
| This article is part of a series on the politics and government of Belgium |
| Constitution |
|
| Foreign relations |
General elections were held in Belgium on 31 March 1968.[1] The Christian Social Party remained the largest party.[2] Voter turnout was 90.0%.[3] Elections for the nine provincial councils were also held.
The snap elections were called after the government, a coalition of the Cristian Social Party and the liberal Party for Freedom and Progress led by Christian democrat Paul Vanden Boeynants, fell due to the Leuven Crisis.
The linguistic crisis would trigger the split of the dominant Christian Social Party into a Flemish and French-speaking party. The two other main parties would follow suit. The crisis also caused the rise of small linguistic, federalist parties, such as the People's Union on the Flemish side and the Democratic Front of the Francophones and Walloon Rally on the French-speaking side.
Results
Chamber of Deputies
| Party | Votes | % | Seats | +/– |
|---|---|---|---|---|
| Christian Social Party | 1,643,785 | 31.75 | 69 | –8 |
| Belgian Socialist Party | 1,403,107 | 27.10 | 59 | –5 |
| Party for Freedom and Progress | 1,080,894 | 20.87 | 47 | –1 |
| People's Union | 506,697 | 9.79 | 20 | +8 |
| Vanden Boeynants Cartel | 236,283 | 4.56 | 0 | New |
| Communist Party of Belgium | 170,625 | 3.30 | 5 | –1 |
| Democratic Front of the Francophones | 154,023 | 2.92 | 6 | +3 |
| Walloon Rally | 151,421 | 2.92 | 6 | New |
| Red Lions | 46,065 | 0.89 | 0 | New |
| Walloon Workers | 3,474 | 0.07 | 0 | New |
| Pro-Peking Communists | 3,119 | 0.06 | 0 | New |
| ULS | 2,694 | 0.05 | 0 | New |
| Return to Liège | 1,933 | 0.04 | 0 | New |
| Flemish Social Movement | 1,922 | 0.04 | 0 | New |
| Kaganovemus | 1,634 | 0.03 | 0 | 0 |
| Dierenbes | 1,608 | 0.03 | 0 | New |
| Walloon Communists | 964 | 0.02 | 0 | New |
| Z. Kleur | 723 | 0.01 | 0 | New |
| Flemish Communists | 702 | 0.01 | 0 | New |
| FU Pop | 572 | 0.01 | 0 | New |
| Trotskyists | 289 | 0.01 | 0 | New |
| SH | 198 | 0.00 | 0 | New |
| RJB | 161 | 0.00 | 0 | New |
| Invalid/blank votes | 376,700 | – | – | – |
| Total | 5,554,652 | 100 | 212 | 0 |
| Registered voters/turnout | 6,170,167 | 90.02 | – | – |
| Source: Belgian Elections | ||||
Senate
| Party | Votes | % | Seats | +/– |
|---|---|---|---|---|
| Belgian Socialist Party | 1,454,879 | 28.46 | 33 | +2 |
| Christian Social Party | 1,393,174 | 27.25 | 29 | –15 |
| Party for Freedom and Progress | 1,114,428 | 21.80 | 22 | –1 |
| People's Union | 513,342 | 10.04 | 9 | +5 |
| FDF-RW | 308,859 | 6.04 | 5 | +4 |
| Communist Party of Belgium | 271,586 | 5.31 | 2 | –1 |
| Vanden Boeyants-Christian Social Party Kartel | 252,331 | 4.94 | 6 | New |
| Red Lions | 45,097 | 0.88 | 0 | New |
| Walloon Workers | 3,777 | 0.07 | 0 | New |
| Pro-Peking Communists | 3,452 | 0.07 | 0 | New |
| Kaganovemus | 2,694 | 0.05 | 0 | 0 |
| ULS | 2,364 | 0.05 | 0 | New |
| Flemish Communists | 801 | 0.02 | 0 | New |
| Walloon Communists | 520 | 0.01 | 0 | New |
| FU Pop | 495 | 0.01 | 0 | New |
| Invalid/blank votes | 441,379 | – | – | – |
| Total | 5,553,197 | 100 | 106 | 0 |
| Registered voters/turnout | 6,170,167 | 90.00 | – | – |
| Source: Belgian Elections | ||||
