Dorset County Council election, 2009
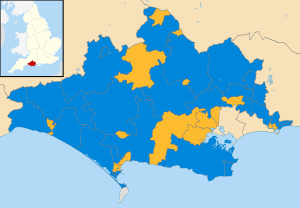
Map of the results of the 2009 Dorset council election. Conservatives in blue, Liberal Democrats in yellow and independent in grey.
Elections to Dorset County Council took place on 4 June 2009.[1] The vote was delayed from 7 May, in order to coincide with elections to the European Parliament. A key issue in the election was an Audit Commission report on social care which reported a decline in standards since 2006, however the Conservative party responded that their administration was the best performing county council in England.[2] There were fears however that voter turnout would be a record low.[3]
Election result summary
| Dorset County Council election, 2009 | ||||||||||
|---|---|---|---|---|---|---|---|---|---|---|
| Party | Seats | Gains | Losses | Net gain/loss | Seats % | Votes % | Votes | +/− | ||
| Conservative | 28 | 6 | 2 | +4 | 62.22 | 48.76 | 76,357 | |||
| Liberal Democrat | 16 | 3 | 3 | 0 | 35.56 | 35.59 | 55,733 | |||
| UKIP | 0 | 0 | 0 | 0 | 0 | 7.35 | 11,505 | |||
| Labour | 0 | 0 | 4 | -4 | 0 | 6.00 | 9,399 | |||
| Green | 0 | 0 | 0 | 0 | 0 | 0.95 | 1,488 | |||
| Independent | 1 | 0 | 0 | 0 | 2.22 | 0.94 | 1,479 | |||
| Citizen's Action Party | 0 | 0 | 0 | 0 | 0 | 0.49 | 781 | |||
| BNP | 0 | 0 | 0 | 0 | 0 | 0.1 | 150 | |||
Election result by division
| Party | Candidate | Votes | % | ± | |
|---|---|---|---|---|---|
| Conservative | Rebecca Knox | 1,713 | 51.53 | ||
| Liberal Democrat | Peter Ivan Jones | 1,264 | 38.03 | ||
| Green | Neil Antony Judd | 280 | 8.42 | ||
| Labour | Thomas Anderson | 67 | 2.02 | ||
| Turnout | 49.37 | ||||
| Conservative hold | Swing | ||||
| Party | Candidate | Votes | % | ± | |
|---|---|---|---|---|---|
| Liberal Democrat | David Charles Thomas Fox | 1,719 | 45.79 | ||
| Conservative | Deborah Anne Croney | 1,473 | 39.24 | ||
| UKIP | Alan Stewart Kewley | 483 | 12.87 | ||
| Labour | Dennis Wardleworth | 79 | 2.10 | ||
| Turnout | 47.46 | ||||
| Liberal Democrat hold | Swing | ||||
| Party | Candidate | Votes | % | ± | |
|---|---|---|---|---|---|
| Liberal Democrat | Barrie George Cooper | 1,633 | 57.06 | ||
| Conservative | Steve Adamson | 1,085 | 37.91 | ||
| Labour | Haydn Roger White | 144 | 5.03 | ||
| Turnout | 38.61 | ||||
| Liberal Democrat hold | Swing | ||||
| Party | Candidate | Votes | % | ± | |
|---|---|---|---|---|---|
| Conservative | Ronald William Coatsworth | 1,730 | 54.40 | ||
| Liberal Democrat | Ros Kayes | 984 | 30.94 | ||
| Independent | Leon Sea | 310 | 9.75 | ||
| Labour | Anna May Alice Birley | 156 | 4.91 | ||
| Turnout | 47.17 | ||||
| Conservative hold | Swing | ||||
| Party | Candidate | Votes | % | ± | |
|---|---|---|---|---|---|
| Liberal Democrat | Karl Gareth Wallace | 1,205 | 42.79 | ||
| Conservative | Sandra Ann Brown | 1,096 | 38.92 | ||
| Green | Julian Stephen Langton Jones | 336 | 11.93 | ||
| Labour | Richard Howard Nicholls | 176 | 6.36 | ||
| Turnout | 37.36 | ||||
| Liberal Democrat gain from Conservative | Swing | ||||
| Party | Candidate | Votes | % | ± | |
|---|---|---|---|---|---|
| Conservative | Andy Cooke | 1,381 | 43.37 | ||
| Liberal Democrat | Christine James | 672 | 21.11 | ||
| Labour | Mike Byatt | 633 | 19.88 | ||
| Green | Brian Anthony Heatley | 498 | 15.64 | ||
| Turnout | 38.04 | ||||
| Conservative gain from Labour | Swing | ||||
| Party | Candidate | Votes | % | ± | |
|---|---|---|---|---|---|
| Conservative | David Charles Jones | 1,102 | 43.54 | ||
| Liberal Democrat | Betty-Ann Fox-Hodges | 676 | 26.71 | ||
| UKIP | Simon Peter Boyd | 453 | 17.90 | ||
| BNP | Barry John Sinclair Bennett | 150 | 5.93 | ||
| Labour | Vera Elizabeth Hill | 150 | 5.93 | ||
| Turnout | 36.66 | ||||
| Conservative gain from Liberal Democrat | Swing | ||||
| Party | Candidate | Votes | % | ± | |
|---|---|---|---|---|---|
| Conservative | Ian Charles Gardner | 1,178 | 46.99 | ||
| Liberal Democrat | Brendan Webster | 1,074 | 42.84 | ||
| Labour | Steve Bick | 255 | 10.17 | ||
| Turnout | 39.12 | ||||
| Conservative hold | Swing | ||||
| Party | Candidate | Votes | % | ± | |
|---|---|---|---|---|---|
| Liberal Democrat | Peter Roger Alexander Hall | 1,438 | 40.84 | ||
| Conservative | Ray Nottage | 1,345 | 38.20 | ||
| UKIP | Rollo Reid | 604 | 17.15 | ||
| Labour | Michael Edward Woods | 134 | 3.81 | ||
| Turnout | 44.59 | ||||
| Liberal Democrat hold | Swing | ||||
| Party | Candidate | Votes | % | ± | |
|---|---|---|---|---|---|
| Liberal Democrat | Janet Dover | 1,486 | 41.81 | ||
| Conservative | David Packer | 1,429 | 40.21 | ||
| UKIP | John Richard Myers | 539 | 15.17 | ||
| Labour | Kay Susanne Wilcox | 100 | 2.81 | ||
| Turnout | 46.81 | ||||
| Liberal Democrat hold | Swing | ||||
| Party | Candidate | Votes | % | ± | |
|---|---|---|---|---|---|
| Conservative | David John Fox | 1,514 | 45.40 | ||
| UKIP | Ric Johnson | 981 | 29.42 | ||
| Liberal Democrat | John Blunden | 644 | 19.31 | ||
| Labour | Robert William Ian Deeks | 196 | 5.88 | ||
| Turnout | 40.2 | ||||
| Conservative hold | Swing | ||||
| Party | Candidate | Votes | % | ± | |
|---|---|---|---|---|---|
| Liberal Democrat | Susan Jefferies | 1,453 | 42.66 | ||
| Conservative | Brian Lane | 1,399 | 41.07 | ||
| UKIP | Josephine Marie Evans | 554 | 16.27 | ||
| Turnout | 42.32 | ||||
| Liberal Democrat hold | Swing | ||||
| Party | Candidate | Votes | % | ± | |
|---|---|---|---|---|---|
| Conservative | Timothy John Palmer | 2,178 | 71.62 | ||
| Liberal Democrat | David Lawrence Tooke | 863 | 28.38 | ||
| Turnout | 44.32 | ||||
| Conservative hold | Swing | ||||
| Party | Candidate | Votes | % | ± | |
|---|---|---|---|---|---|
| Liberal Democrat | Richard Martin Biggs | 3,085 | 26.66 | ||
| Liberal Democrat | David Trevor Jones | 3,068 | 26.52 | ||
| Conservative | Mary Penfold | 2,192 | 18.95 | ||
| Conservative | Jonathan Halewood | 2,053 | 17.74 | ||
| Labour Co-op | Vicki Black | 623 | 5.38 | ||
| Labour Co-op | Andy Hutchings | 549 | 4.75 | ||
| Turnout | 43.1 | ||||
| Liberal Democrat hold | Swing | ||||
| Liberal Democrat hold | Swing | ||||
| Party | Candidate | Votes | % | ± | |
|---|---|---|---|---|---|
| Liberal Democrat | Alex Brenton | 1,373 | 46.96 | ||
| Conservative | Malcolm Leonard Shakesby | 1,369 | 46.82 | ||
| Labour | David Llewellyn Kelsey Stokes | 182 | 6.22 | ||
| Turnout | 43.72 | ||||
| Liberal Democrat gain from Conservative | Swing | ||||
| Party | Candidate | Votes | % | ± | |
|---|---|---|---|---|---|
| Conservative | John Leslie Wilson | 3,575 | 28.24 | ||
| Conservative | Derek Bidkar Frank Burt | 3,460 | 27.33 | ||
| UKIP | David Leigh Baxter | 1,780 | 14.06 | ||
| UKIP | John Lees Baxter | 1,691 | 13.36 | ||
| Liberal Democrat | Margaret Martin | 913 | 7.21 | ||
| Liberal Democrat | Phillip Graeme Cuckstone | 873 | 6.90 | ||
| Labour | Christopher Hampton | 368 | 2.91 | ||
| Turnout | 42.76 | ||||
| Conservative hold | Swing | ||||
| Conservative hold | Swing | ||||
| Party | Candidate | Votes | % | ± | |
|---|---|---|---|---|---|
| Liberal Democrat | David Milsted | 1,606 | 49.04 | ||
| Conservative | Nick Mason | 1,528 | 46.66 | ||
| Labour | Terry Joyes | 141 | 4.31 | ||
| Turnout | 42.88 | ||||
| Liberal Democrat hold | Swing | ||||
| Party | Candidate | Votes | % | ± | |
|---|---|---|---|---|---|
| Conservative | Angus Campbell | 2,437 | 65.97 | ||
| Liberal Democrat | Graeme Henry Hole | 1,098 | 29.72 | ||
| Labour | Keith Yarwood | 159 | 4.30 | ||
| Turnout | 45.3 | ||||
| Conservative hold | Swing | ||||
| Party | Candidate | Votes | % | ± | |
|---|---|---|---|---|---|
| Conservative | Colin Peter Jamieson | 1,833 | 51.66 | ||
| UKIP | Philip Glover | 887 | 25 | ||
| Liberal Democrat | Jonathan Christopher Stephen Foster | 615 | 17.33 | ||
| Labour | Rob Maskell | 213 | 6 | ||
| Turnout | 46.27 | ||||
| Conservative hold | Swing | ||||
| Party | Candidate | Votes | % | ± | |
|---|---|---|---|---|---|
| Conservative | David Crowhurst | 1,945 | 58.13 | ||
| Liberal Democrat | Tim Harries | 1,135 | 33.92 | ||
| Labour | Daniel Peter Alec Hassell | 266 | 7.95 | ||
| Turnout | 43.33 | ||||
| Conservative hold | Swing | ||||
| Party | Candidate | Votes | % | ± | |
|---|---|---|---|---|---|
| Liberal Democrat | Brian Ellis | 1,792 | 49.10 | ||
| Conservative | Ian Bruce | 1,616 | 44.27 | ||
| Labour | Maureen Audrey Drake | 242 | 6.63 | ||
| Turnout | 49.86 | ||||
| Liberal Democrat hold | Swing | ||||
| Party | Candidate | Votes | % | ± | |
|---|---|---|---|---|---|
| Liberal Democrat | Frederick Henry Drane | 1,873 | 51.15 | ||
| Conservative | Bill Pipe | 1,643 | 44.87 | ||
| Labour | James Sebastian Selby Bennett | 146 | 3.99 | ||
| Turnout | 41.45 | ||||
| Liberal Democrat hold | Swing | ||||
| Party | Candidate | Votes | % | ± | |
|---|---|---|---|---|---|
| Conservative | Geoffrey John Brierley | 1,749 | 56.75 | ||
| Liberal Democrat | Christopher John Savory | 1,152 | 37.38 | ||
| Labour | Carole Ann Murless | 181 | 5.87 | ||
| Turnout | 41.62 | ||||
| Conservative hold | Swing | ||||
| Party | Candidate | Votes | % | ± | |
|---|---|---|---|---|---|
| Conservative | Robin David Cook | 1,594 | 50.43 | ||
| Liberal Democrat | Marilyn Blanche Osner | 1,567 | 49.57 | ||
| Turnout | 41.65 | ||||
| Conservative gain from Liberal Democrat | Swing | ||||
| Party | Candidate | Votes | % | ± | |
|---|---|---|---|---|---|
| Conservative | Alan John Charles Griffiths | 2,356 | 60.15 | ||
| UKIP | Brian Hogger | 642 | 16.39 | ||
| Liberal Democrat | John Campbell | 487 | 12.43 | ||
| Labour | Carol Ann Wilcox | 254 | 6.48 | ||
| Independent | Lindsay Margaret Turner | 178 | 4.54 | ||
| Turnout | 51.57 | ||||
| Conservative hold | Swing | ||||
| Party | Candidate | Votes | % | ± | |
|---|---|---|---|---|---|
| Conservative | Tim Munro | 795 | 32.74 | ||
| Labour | Anne Kenwood | 584 | 24.05 | ||
| Liberal Democrat | Trefor Morgan | 555 | 22.86 | ||
| Citizen's Action Party | Richard Denton-White | 494 | 20.35 | ||
| Turnout | 34.32 | ||||
| Conservative gain from Labour | Swing | ||||
| Party | Candidate | Votes | % | ± | |
|---|---|---|---|---|---|
| Independent | Les Ames | 991 | 44.56 | ||
| Conservative | Ian Munro-Price | 637 | 28.64 | ||
| Labour | Sandy West | 309 | 13.89 | ||
| Citizen's Action Party | Don Roach | 287 | 12.90 | ||
| Turnout | 33.94 | ||||
| Independent hold | Swing | ||||
| Party | Candidate | Votes | % | ± | |
|---|---|---|---|---|---|
| Conservative | Michael William John Lovell | 1,605 | 59.75 | ||
| Liberal Democrat | Beryl Rita Ezzard | 898 | 33.43 | ||
| Labour | Leigh Van de Zande | 183 | 6.81 | ||
| Turnout | 47.92 | ||||
| Conservative hold | Swing | ||||
| Party | Candidate | Votes | % | ± | |
|---|---|---|---|---|---|
| Conservative | Nigel Reed | 1,126 | 41.53 | ||
| Liberal Democrat | John Birtwistle | 1,019 | 37.59 | ||
| Labour | Kate Wheller | 566 | 20.88 | ||
| Turnout | 39.14 | ||||
| Conservative gain from Labour | Swing | ||||
| Party | Candidate | Votes | % | ± | |
|---|---|---|---|---|---|
| Liberal Democrat | Mervyn Jeffrey | 1,319 | 53.60 | ||
| Conservative | Jane Katherine Gould | 1,061 | 43.11 | ||
| Labour | Christine Pamela Moss | 81 | 3.29 | ||
| Turnout | 45.79 | ||||
| Liberal Democrat hold | Swing | ||||
| Party | Candidate | Votes | % | ± | |
|---|---|---|---|---|---|
| Conservative | Robert Andrew Gould | 1,639 | 52.65 | ||
| Liberal Democrat | Jan Palmer | 942 | 30.26 | ||
| Green | Susan Greene | 374 | 12.01 | ||
| Labour | Graham John Parish | 158 | 5.08 | ||
| Turnout | 44.32 | ||||
| Conservative hold | Swing | ||||
| Party | Candidate | Votes | % | ± | |
|---|---|---|---|---|---|
| Conservative | Michael James Bevan | 2,080 | 51.19 | ||
| Liberal Democrat | Robin Andrew Shane Legg | 1,871 | 46.05 | ||
| Labour | Kate Parish | 112 | 2.76 | ||
| Turnout | 52.2 | ||||
| Conservative gain from Liberal Democrat | Swing | ||||
| Party | Candidate | Votes | % | ± | |
|---|---|---|---|---|---|
| Conservative | Peter William Richardson | 1,879 | 63.69 | ||
| UKIP | Allan Stephen Tallett | 627 | 21.25 | ||
| Liberal Democrat | Nick Smith | 444 | 15.05 | ||
| Turnout | 49.65 | ||||
| Conservative hold | Swing | ||||
| Party | Candidate | Votes | % | ± | |
|---|---|---|---|---|---|
| Conservative | Andrew Ronald Cattaway | 1,905 | 59.05 | ||
| Liberal Democrat | Ian Stewart | 1,222 | 37.88 | ||
| Labour | David John Harvey | 99 | 3.07 | ||
| Turnout | 45.95 | ||||
| Conservative hold | Swing | ||||
| Party | Candidate | Votes | % | ± | |
|---|---|---|---|---|---|
| Conservative | William Stanley Trite | 1,507 | 40.95 | ||
| Liberal Democrat | Peter B Clark | 1,155 | 31.39 | ||
| UKIP | Mike Hobson | 652 | 17.72 | ||
| Labour | Max Stanford | 366 | 9.95 | ||
| Turnout | 45.29 | ||||
| Conservative hold | Swing | ||||
| Party | Candidate | Votes | % | ± | |
|---|---|---|---|---|---|
| Conservative | Jill Haynes | 2,154 | 57.92 | ||
| Liberal Democrat | Andrew James Canning | 1,302 | 35.01 | ||
| Labour | Harry Burden | 263 | 7.07 | ||
| Turnout | 45.91 | ||||
| Conservative hold | Swing | ||||
| Party | Candidate | Votes | % | ± | |
|---|---|---|---|---|---|
| Conservative | Toni Bartley Coombs | 2,939 | 32.39 | ||
| Conservative | Spencer Grant Flower | 2,814 | 31.01 | ||
| Liberal Democrat | Alan Stuart Dorey | 1,555 | 17.13 | ||
| Liberal Democrat | Heidi Maria James | 1,506 | 16.60 | ||
| Labour | Mike Ellis | 261 | 2.88 | ||
| Turnout | 41.78 | ||||
| Conservative hold | Swing | ||||
| Conservative hold | Swing | ||||
| Party | Candidate | Votes | % | ± | |
|---|---|---|---|---|---|
| Liberal Democrat | David Anthony Budd | 1,535 | 48.35 | ||
| Conservative | Jane Thomas | 1,172 | 36.91 | ||
| UKIP | Keith Allen Simpson | 377 | 11.87 | ||
| Labour | Rosemary Smith | 91 | 2.87 | ||
| Turnout | 47.23 | ||||
| Liberal Democrat hold | Swing | ||||
| Party | Candidate | Votes | % | ± | |
|---|---|---|---|---|---|
| Conservative | Peter James Michael Finney | 1,623 | 45.68 | ||
| Liberal Democrat | Peter Holden | 1,268 | 35.69 | ||
| UKIP | Dave Butt | 662 | 18.63 | ||
| Turnout | 47.46 | ||||
| Conservative hold | Swing | ||||
| Party | Candidate | Votes | % | ± | |
|---|---|---|---|---|---|
| Liberal Democrat | David Harris | 1,336 | 52.87 | ||
| Conservative | Ian James | 757 | 29.96 | ||
| Labour | Mike Owen | 434 | 17.17 | ||
| Turnout | 36.06 | ||||
| Liberal Democrat gain from Labour | Swing | ||||
| Party | Candidate | Votes | % | ± | |
|---|---|---|---|---|---|
| Liberal Democrat | Howard Legg | 1,244 | 51.55 | ||
| Conservative | Peter Michael Farrell | 869 | 36.01 | ||
| Labour | Colin Huckle | 300 | 12.43 | ||
| Turnout | 31.14 | ||||
| Liberal Democrat hold | Swing | ||||
| Party | Candidate | Votes | % | ± | |
|---|---|---|---|---|---|
| Conservative | Hilary Ann Cox | 1,822 | 53.84 | ||
| Liberal Democrat | Graham Douglas Burton | 814 | 24.05 | ||
| UKIP | Bob Pilkington | 573 | 16.93 | ||
| Labour | Kim Fendley | 175 | 5.17 | ||
| Turnout | 44.33 | ||||
| Conservative hold | Swing | ||||
References
- ↑ Elections 2009 - Dorset at bbc.co.uk
- ↑ "Dorset county council local election 2009". The Daily Telegraph. 2009-05-18. Retrieved 2009-06-04.
- ↑ "Polls in Dorset set for record low turn-out". Dorset Echo. 2009-06-03. Retrieved 2009-06-04.
- ↑ "2009 Dorset County Council election results". Retrieved 7 September 2011.
External links
- Election Nominations - full list of nominated candidates, at Dorset County website
| Dorset County Council | |
|---|---|
| Bournemouth Borough Council | |
| Christchurch Borough Council | |
| East Dorset District Council | |
| North Dorset District Council |
|
| Poole Borough Council | |
| Purbeck District Council | |
| West Dorset District Council | |
| Weymouth and Portland Borough Council | |
| |
| County council elections |
|
|---|---|
| Mayoral elections | |
| Unitary authorities |
|
Bold indicates a new unitary authority. Stoke-on-Trent cancelled mayoral election after abolishing mayoral system. | |
This article is issued from Wikipedia - version of the 4/14/2015. The text is available under the Creative Commons Attribution/Share Alike but additional terms may apply for the media files.