Epping Forest District Council election, 2014
2014 local election results in Epping Forest
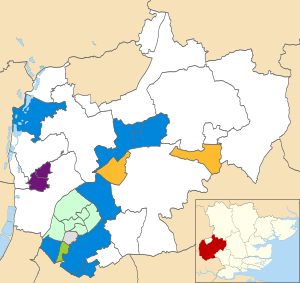
The 2014 Epping Forest District Council election took place on 22 May 2014 to elect members of Epping Forest District Council in England.[1] This was on the same day as other local elections.
Summary Results
Ward Results
Buckhurst Hill East
| Party | Candidate | Votes | % | ± | |
|---|---|---|---|---|---|
| Green | Steven Neville | 635 | 41.1 | +23.3 | |
| Conservative | Aniket Patel | 574 | 37.4 | -5.2 | |
| Liberal Democrat | Chris Greaves | 210 | 13.7 | -8.2 | |
| Labour | Pamela Griffin | 115 | 7.5 | -9.9 | |
| Majority | 61 | 4.0 | N/A | ||
| Turnout | |||||
| Green gain from Liberal Democrat | Swing | ||||
Buckhurst Hill West
| Party | Candidate | Votes | % | ± | |
|---|---|---|---|---|---|
| Conservative | Sylvia Watson | 1,136 | 61.4 | +14.5 | |
| Green | Roger Neville | 279 | 15.1 | +9.0 | |
| Liberal Democrat | Garry Sadler | 219 | 11.8 | -19.1 | |
| Labour | Andrew Forsey | 178 | 9.6 | +1.7 | |
| Independent | Gerald Wandsworth | 37 | 2.0 | N/A | |
| Majority | |||||
| Turnout | |||||
| Conservative hold | Swing | ||||
Chigwell Village
| Party | Candidate | Votes | % | ± | |
|---|---|---|---|---|---|
| Conservative | Lesley Wagland | 682 | 62.4 | -1.3 | |
| UKIP | Kane Khan | 187 | 17.1 | -1.7 | |
| Labour | Isuru Perera | 123 | 11.3 | +1.2 | |
| Green | Christopher Lord | 63 | 5.8 | +0.5 | |
| Liberal Democrat | George Lund | 38 | 3.5 | +1.1 | |
| Majority | |||||
| Turnout | |||||
| Conservative hold | Swing | ||||
Chipping Ongar, Greensted & Marden Ash
| Party | Candidate | Votes | % | ± | |
|---|---|---|---|---|---|
| Liberal Democrat | Brian Surtees | 421 | 29.5 | -1.9 | |
| Conservative | Nigel Bedford | 413 | 28.9 | -13.9 | |
| UKIP | Michael McGough | 411 | 28.8 | N/A | |
| Green | Nicola Harris | 148 | 10.4 | +4.1 | |
| English Democrat | Robin Tilbrook | 36 | 2.5 | -7.0 | |
| Majority | |||||
| Turnout | |||||
| Liberal Democrat hold | Swing | ||||
Epping Hemnall
| Party | Candidate | Votes | % | ± | |
|---|---|---|---|---|---|
| Liberal Democrat | Janet Whitehouse | 847 | 42.5 | -6.8 | |
| UKIP | Andrew Smith | 511 | 25.6 | +12.0 | |
| Conservative | Jonathan Kent | 420 | 21.1 | -5.8 | |
| Labour | Lorraine Collier | 128 | 6.4 | -3.8 | |
| Green | Anne Widdup | 87 | 4.4 | N/A | |
| Majority | |||||
| Turnout | |||||
| Liberal Democrat hold | Swing | ||||
Epping Lindsay & Thornwood Common
| Party | Candidate | Votes | % | ± | |
|---|---|---|---|---|---|
| Conservative | William Breare-Hall | 719 | 37.6 | -16.7 | |
| UKIP | Barbara Robertson | 566 | 29.6 | N/A | |
| Liberal Democrat | Ingrid Black | 267 | 14.0 | +5.3 | |
| Labour | Simon Bullough | 232 | 12.1 | -15.5 | |
| Green | William Hartington | 130 | 6.8 | -2.6 | |
| Majority | |||||
| Turnout | |||||
| Conservative hold | Swing | ||||
Grange Hill
| Party | Candidate | Votes | % | ± | |
|---|---|---|---|---|---|
| Conservative | Gagan Mohindra | 815 | 54.4 | -6.6 | |
| Green | Alison Lord | 355 | 23.7 | N/A | |
| Liberal Democrat | Pesh Kapasiawala | 328 | 21.9 | +5.1 | |
| Majority | |||||
| Turnout | |||||
| Conservative hold | Swing | ||||
Loughton Alderton
| Party | Candidate | Votes | % | ± | |
|---|---|---|---|---|---|
| Loughton Residents | Chris Roberts | 643 | 57.8 | +0.7 | |
| Conservative | Chris Criscione | 194 | 17.4 | +2.4 | |
| Labour | Angela Ayre | 147 | 13.2 | -0.9 | |
| Independent | Paul Morris | 105 | 9.4 | -0.4 | |
| Liberal Democrat | Bhupendra Patel | 24 | 2.2 | +1.1 | |
| Majority | |||||
| Turnout | |||||
| Loughton Residents hold | Swing | ||||
Loughton Broadway
| Party | Candidate | Votes | % | ± | |
|---|---|---|---|---|---|
| Loughton Residents | Chris Pond | 423 | 41.1 | -10.1 | |
| UKIP | Barry Johns | 357 | 34.7 | N/A | |
| Labour | Margaret Owen | 157 | 14.3 | +0.4 | |
| Conservative | Robert Luchford | 102 | 9.9 | -3.4 | |
| Majority | |||||
| Turnout | |||||
| Loughton Residents hold | Swing | ||||
Loughton Fairmead
| Party | Candidate | Votes | % | ± | |
|---|---|---|---|---|---|
| Loughton Residents | Louise Mead | 523 | 50.4 | -3.5 | |
| UKIP | Ronald McEvoy | 262 | 25.3 | N/A | |
| Conservative | Ryan Sparrowhawk | 153 | 14.8 | +0.4 | |
| Labour | Ben Spencer | 99 | 9.6 | -9.9 | |
| Majority | |||||
| Turnout | |||||
| Loughton Residents hold | Swing | ||||
Loughton Forest
| Party | Candidate | Votes | % | ± | |
|---|---|---|---|---|---|
| Loughton Residents | Sharon Weston | 755 | 55.7 | +11.7 | |
| Conservative | Andrew Kovler | 488 | 36.0 | -14.0 | |
| Labour | Janice Cooke | 74 | 5.5 | +1.1 | |
| Liberal Democrat | Elonor Spencer | 38 | 2.8 | +1.6 | |
| Majority | |||||
| Turnout | |||||
| Loughton Residents hold | Swing | ||||
Loughton Roding
| Party | Candidate | Votes | % | ± | |
|---|---|---|---|---|---|
| Independent | Stephen Murray | 1,207 | 81.5 | +18.1 | |
| Conservative | Joanne Share-Bernia | 164 | 11.1 | -10.1 | |
| Labour | Tom Owen | 59 | 4.0 | -11.4 | |
| Green | Benjamin Wille | 50 | 3.4 | N/A | |
| Majority | |||||
| Turnout | |||||
| Independent hold | Swing | ||||
Loughton St. John's
| Party | Candidate | Votes | % | ± | |
|---|---|---|---|---|---|
| Loughton Residents | Bob Jennings | 904 | 69.8 | +7.4 | |
| Conservative | Neil Cohen | 274 | 21.2 | -5.4 | |
| Labour | Jill Bostock | 93 | 7.2 | -0.4 | |
| Liberal Democrat | Enid Robinson | 29 | 2.1 | N/A | |
| Majority | |||||
| Turnout | |||||
| Loughton Residents hold | Swing | ||||
Loughton St. Mary's
| Party | Candidate | Votes | % | ± | |
|---|---|---|---|---|---|
| Loughton Residents | Howard Kauffman | 915 | 67.1 | +17.0 | |
| Conservative | Ivan Kovler | 316 | 23.2 | -15.1 | |
| Labour | Laurence Morter | 103 | 7.6 | +0.6 | |
| Liberal Democrat | Enid Robinson | 29 | 2.1 | N/A | |
| Majority | |||||
| Turnout | |||||
| Loughton Residents hold | Swing | ||||
Lower Nazeing
| Party | Candidate | Votes | % | ± | |
|---|---|---|---|---|---|
| Conservative | Yolanda Knight | 806 | 69.0 | -0.4 | |
| Green | Barry Phillips | 197 | 16.9 | +12.3 | |
| Labour | Kelvin Morris | 165 | 14.1 | -1.5 | |
| Majority | |||||
| Turnout | |||||
| Conservative hold | Swing | ||||
North Weald Bassett
| Party | Candidate | Votes | % | ± | |
|---|---|---|---|---|---|
| Conservative | David Stallan | 744 | 58.8 | -17.8 | |
| UKIP | Paul Stevens | 438 | 34.6 | N/A | |
| Liberal Democrat | Arnold Verrall | 83 | 6.6 | -1.5 | |
| Majority | |||||
| Turnout | |||||
| Conservative hold | Swing | ||||
Theydon Bois
| Party | Candidate | Votes | % | ± | |
|---|---|---|---|---|---|
| Conservative | Susan Jones | 898 | 70.4 | +29.9 | |
| Liberal Democrat | Annie Wood | 378 | 29.6 | -11.3 | |
| Majority | |||||
| Turnout | |||||
| Conservative hold | Swing | ||||
Waltham Abbey Honey Lane
| Party | Candidate | Votes | % | ± | |
|---|---|---|---|---|---|
| UKIP | Rod Butler | 604 | 44.7 | N/A | |
| Conservative | Sam Kane | 499 | 36.9 | -30.9 | |
| Labour | Joanna Skinner | 248 | 18.4 | -2.4 | |
| Majority | |||||
| Turnout | |||||
| UKIP gain from Conservative | Swing | ||||
Waltham Abbey Paternoster
| Party | Candidate | Votes | % | ± | |
|---|---|---|---|---|---|
| UKIP | David Dorrell | 428 | 44.7 | N/A | |
| Conservative | Jodie Lucas | 328 | 34.2 | -28.8 | |
| Labour | Robert Grayson | 168 | 17.5 | -9.5 | |
| Liberal Democrat | Phil Chadburn | 34 | 3.6 | -6.4 | |
| Majority | |||||
| Turnout | |||||
| UKIP gain from Conservative | Swing | ||||
References
- ↑ "England council results". BBC News. Retrieved 23 May 2014.
This article is issued from Wikipedia - version of the 10/17/2016. The text is available under the Creative Commons Attribution/Share Alike but additional terms may apply for the media files.