Fenland District Council election, 2003
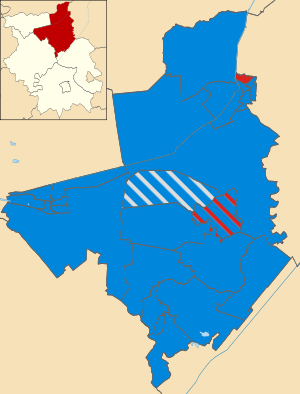
Map of the results of the 2003 Fenland council election. Conservatives in blue, Labour in red and independent in grey.
The 2003 Fenland District Council election took place on 1 May 2003 to elect members of Fenland District Council in Cambridgeshire, England. The whole council was up for election with boundary changes since the last election in 1999.[1] The Conservative party stayed in overall control of the council.[2]
Election result
The results saw the Conservatives easily stay in control of the council taking 36 of the 40 seats, with Conservative candidates having been unopposed in 11 wards.[3] The only ward where any other group won all of the seats was in Waterlees in Wisbech, where Labour took both seats.[3]
| Fenland Local Election Result 2003[4][2] | ||||||||||
|---|---|---|---|---|---|---|---|---|---|---|
| Party | Seats | Gains | Losses | Net gain/loss | Seats % | Votes % | Votes | +/− | ||
| Conservative | 36 | +7 | 90.0 | 67.5 | 13,088 | |||||
| Labour | 3 | -4 | 7.5 | 21.7 | 4,209 | |||||
| Independent | 1 | -2 | 2.5 | 6.7 | 1,306 | |||||
| Liberal Democrat | 0 | -1 | 0 | 2.9 | 567 | |||||
| Green | 0 | 0 | 0 | 1.1 | 223 | |||||
14 Conservative candidates were unopposed at the election.[4]
Ward results
| Party | Candidate | Votes | % | ± | |
|---|---|---|---|---|---|
| Conservative | Kenneth Mayor | unopposed | |||
| Party | Candidate | Votes | % | ± | |
|---|---|---|---|---|---|
| Conservative | Thomas Butcher | unopposed | |||
| Conservative | Pamela Potts | unopposed | |||
| Party | Candidate | Votes | % | ± | |
|---|---|---|---|---|---|
| Conservative | Alan Melton | 304 | 66.5 | ||
| Labour | David Biggs | 153 | 33.5 | ||
| Majority | 151 | 33.0 | |||
| Turnout | 457 | 28.7 | |||
| Party | Candidate | Votes | % | ± | |
|---|---|---|---|---|---|
| Conservative | Carol Cox | 245 | 64.6 | ||
| Labour | Ann Purt | 134 | 35.4 | ||
| Majority | 111 | 29.3 | |||
| Turnout | 379 | 23.9 | |||
| Party | Candidate | Votes | % | ± | |
|---|---|---|---|---|---|
| Conservative | Denise Laws | unopposed | |||
| Party | Candidate | Votes | % | ± | |
|---|---|---|---|---|---|
| Conservative | Geoffrey Harper | unopposed | |||
| Party | Candidate | Votes | % | ± | |
|---|---|---|---|---|---|
| Conservative | Malcolm Cotterell | 550 | |||
| Conservative | Evelyn Green | 486 | |||
| Independent | Phillip Webb | 368 | |||
| Turnout | 1,404 | 27.2 | |||
| Party | Candidate | Votes | % | ± | |
|---|---|---|---|---|---|
| Conservative | Simon King | 621 | |||
| Conservative | Henry Wegg | 574 | |||
| Labour | Lewis Purt | 258 | |||
| Turnout | 1,453 | 25.4 | |||
| Party | Candidate | Votes | % | ± | |
|---|---|---|---|---|---|
| Conservative | Martin Curtis | 239 | 57.6 | ||
| Labour | Douglas Costain | 176 | 42.4 | ||
| Majority | 63 | 15.2 | |||
| Turnout | 415 | 32.1 | |||
| Party | Candidate | Votes | % | ± | |
|---|---|---|---|---|---|
| Conservative | Leslie Sims | 245 | 66.9 | ||
| Labour | Ronald Harris | 121 | 33.1 | ||
| Majority | 124 | 33.9 | |||
| Turnout | 366 | 21.6 | |||
| Party | Candidate | Votes | % | ± | |
|---|---|---|---|---|---|
| Conservative | Stephen Garratt | unopposed | |||
| Party | Candidate | Votes | % | ± | |
|---|---|---|---|---|---|
| Conservative | Paul Jolley | unopposed | |||
| Party | Candidate | Votes | % | ± | |
|---|---|---|---|---|---|
| Conservative | Bernard Keane | 805 | |||
| Conservative | Frederick Yeulett | 674 | |||
| Labour | Barry Howlett | 672 | |||
| Labour | Barry Wales | 662 | |||
| Conservative | Leon Hyde | 624 | |||
| Labour | Martin Field | 509 | |||
| Green | Christopher Bennett | 223 | |||
| Turnout | 4,169 | 29.0 | |||
| Party | Candidate | Votes | % | ± | |
|---|---|---|---|---|---|
| Independent | Patricia Brewin | 716 | |||
| Conservative | Trevor Quince | 641 | |||
| Conservative | John West | 633 | |||
| Conservative | Kimberley French | 612 | |||
| Turnout | 2,602 | 24.1 | |||
| Party | Candidate | Votes | % | ± | |
|---|---|---|---|---|---|
| Conservative | Janet French | unopposed | |||
| Conservative | Christopher Owen | unopposed | |||
| Conservative | Peter Skoulding | unopposed | |||
| Party | Candidate | Votes | % | ± | |
|---|---|---|---|---|---|
| Conservative | Jonathon Farmer | unopposed | |||
| Party | Candidate | Votes | % | ± | |
|---|---|---|---|---|---|
| Conservative | Cyril Bellamy | 683 | |||
| Conservative | Clifford Edwards | 630 | |||
| Labour | John Cook | 264 | |||
| Turnout | 1,577 | 29.7 | |||
| Party | Candidate | Votes | % | ± | |
|---|---|---|---|---|---|
| Conservative | Elizabeth Carlisle | 295 | 77.2 | ||
| Labour | Simon Massen | 87 | 22.8 | ||
| Majority | 208 | 54.5 | |||
| Turnout | 382 | 22.9 | |||
| Party | Candidate | Votes | % | ± | |
|---|---|---|---|---|---|
| Conservative | Michael Humphrey | 851 | |||
| Conservative | Brian Hardy | 849 | |||
| Conservative | Peter Ward | 810 | |||
| Labour | Richard Hibbert | 329 | |||
| Turnout | 2,839 | 27.8 | |||
| Party | Candidate | Votes | % | ± | |
|---|---|---|---|---|---|
| Conservative | Peter Dickinson | 165 | 39.4 | ||
| Liberal Democrat | Christopher Howes | 129 | 30.8 | ||
| Labour | Grant Osbourn | 125 | 29.8 | ||
| Majority | 36 | 8.6 | |||
| Turnout | 419 | 25.6 | |||
| Party | Candidate | Votes | % | ± | |
|---|---|---|---|---|---|
| Conservative | Ronald Speechley | unopposed | |||
| Party | Candidate | Votes | % | ± | |
|---|---|---|---|---|---|
| Conservative | Ursula Cuffe | unopposed | |||
| Party | Candidate | Votes | % | ± | |
|---|---|---|---|---|---|
| Conservative | Anthony Green | unopposed | |||
| Party | Candidate | Votes | % | ± | |
|---|---|---|---|---|---|
| Conservative | Albert German | 360 | 61.9 | ||
| Independent | Stephen Wilson | 222 | 38.1 | ||
| Majority | 138 | 23.7 | |||
| Turnout | 582 | 31.1 | |||
| Party | Candidate | Votes | % | ± | |
|---|---|---|---|---|---|
| Labour | Stephen Cawthorne | 317 | |||
| Labour | Avis Gilliatt | 297 | |||
| Conservative | Yvonne Lawrence | 230 | |||
| Conservative | Susanah Farmer | 192 | |||
| Liberal Democrat | Paul Clapp | 162 | |||
| Turnout | 1,198 | 17.7 | |||
| Party | Candidate | Votes | % | ± | |
|---|---|---|---|---|---|
| Conservative | Peter Murphy | 353 | 56.1 | ||
| Liberal Democrat | Florence Newell | 276 | 43.9 | ||
| Majority | 77 | 12.2 | |||
| Turnout | 629 | 35.1 | |||
| Party | Candidate | Votes | % | ± | |
|---|---|---|---|---|---|
| Conservative | Jillian Tuck | 417 | 79.9 | ||
| Labour | Claire Osbourn | 105 | 20.1 | ||
| Majority | 312 | 59.8 | |||
| Turnout | 522 | 37.4 | |||
References
- ↑ "Local elections". BBC News Online. Retrieved 11 September 2011.
- 1 2 "Local council election results". The Daily Telegraph. 3 May 2003. Retrieved 12 September 2011.
- 1 2 "Fenland District Council results 2003". BBC News Online. Retrieved 12 September 2011.
- 1 2 3 4 5 6 7 8 9 10 11 12 13 14 15 16 17 18 19 20 21 22 23 24 25 26 27 28 29 "Election Results". Fenland District Council. Political Science Resources. Retrieved 12 September 2011.
| Cambridgeshire County Council | |
|---|---|
| Peterborough City Council | |
| Cambridge City Council | |
| East Cambridgeshire District Council |
|
| Fenland District Council | |
| Huntingdonshire District Council | |
| South Cambridgeshire District Council | |
| Isle of Ely County Council |
|
| Huntingdon & Peterborough County Council |
|
| |
| Metropolitan boroughs |
|
|---|---|
| Unitary authorities |
|
| District councils (England) |
|
| Scottish councils |
|
| National Assembly elections | |
This article is issued from Wikipedia - version of the 11/24/2015. The text is available under the Creative Commons Attribution/Share Alike but additional terms may apply for the media files.