Waterford City Council election, 2004
Waterford City Council election, 2004

|
|
|
|
|

|
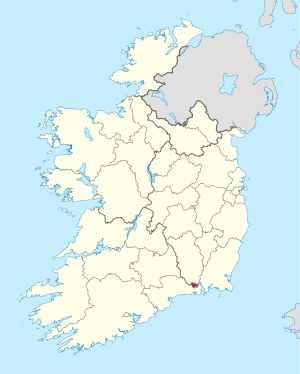
| Map showing the area of Waterford City Council |
|
Council control after election
TBD
|
|
|
An election to Waterford City Council took place on 10 June 1999 as part of that year's Irish local elections. 15 councillors were elected from three electoral divisions by PR-STV voting for a five-year term of office.
Results by party
Results by Electoral Area
Waterford No.1
| Waterford No.1 - 4 seats |
| Party | Candidate | % 1st Pref | Count 1 | Count 2 | Count 3 | Count 4 | Count 5 | Count 6 |
|
Fine Gael |
Hilary Quinlan* |
20.82 |
923 |
|
|
|
|
|
|
Labour Party |
Pat Hayes* |
19.69 |
873 |
884 |
896 |
|
|
|
|
Sinn Féin |
Joe Kelly |
14.89 |
660 |
663 |
674 |
699 |
765 |
817 |
|
Workers' Party |
Davy Walsh* |
11.28 |
500 |
504 |
511 |
576 |
640 |
759 |
|
Fianna Fáil |
Sean Dower* |
9.90 |
439 |
442 |
503 |
530 |
589 |
688 |
|
Independent |
Pat Power |
7.58 |
336 |
340 |
351 |
387 |
464 |
|
|
Independent |
Oli Dempsey |
7.08 |
314 |
316 |
331 |
367 |
|
|
|
Fine Gael |
Dick Hayden |
5.64 |
250 |
258 |
264 |
|
|
|
|
Fianna Fáil |
Maurice Walsh |
3.11 |
138 |
139 |
|
|
|
|
| Electorate: 7,534 Valid: 4,433 (58.84%) Spoilt: 145 Quota: 887 Turnout: 4,578 (60.76%) |
Waterford No.2
| Waterford No.2 - 5 seats |
| Party | Candidate | % 1st Pref | Count 1 | Count 2 | Count 3 | Count 4 | Count 5 | Count 6 | Count 7 | Count 8 |
|
Independent |
Davy Daniels* |
23.10 |
1,620 |
|
|
|
|
|
|
|
|
Labour Party |
Jack Walsh |
10.49 |
736 |
778 |
810 |
835 |
892 |
1,047 |
1,218 |
|
|
Independent |
Mary Roche* |
9.53 |
668 |
752 |
803 |
866 |
976 |
1,139 |
1,319 |
|
|
Fine Gael |
Jim D'Arcy |
8.61 |
604 |
646 |
673 |
702 |
787 |
869 |
921 |
950 |
|
Sinn Féin |
Frank Walsh |
8.51 |
597 |
616 |
629 |
656 |
708 |
764 |
|
|
|
Fine Gael |
Tom Cunningham* |
8.40 |
589 |
651 |
733 |
782 |
902 |
959 |
1,008 |
1,033 |
|
Green Party |
Brendan McCann |
7.53 |
528 |
561 |
590 |
614 |
651 |
|
|
|
|
Fine Gael |
Jacqueline Kelly |
6.72 |
471 |
513 |
549 |
601 |
|
|
|
|
|
Fianna Fáil |
Stephanie Keating |
6.16 |
432 |
469 |
500 |
|
|
|
|
|
|
Fianna Fáil |
Michael Ivory* |
6.02 |
422 |
467 |
518 |
697 |
743 |
774 |
830 |
856 |
|
Progressive Democrats |
Oliver Clery* |
4.93 |
346 |
391 |
|
|
|
|
|
|
| Electorate: 11,949 Valid: 7,013 (58.69%) Spoilt: 108 Quota: 1,169 Turnout: 7,121 (59.59%) |
Waterford No.3
| Waterford No.3 - 6 seats |
| Party | Candidate | % 1st Pref | Count 1 | Count 2 | Count 3 | Count 4 | Count 5 | Count 6 | Count 7 | Count 8 | Count 9 | Count 10 |
|
Workers' Party |
John Halligan* |
18.65 |
1,123 |
|
|
|
|
|
|
|
|
|
|
Sinn Féin |
David Cullinane |
18.42 |
1,109 |
|
|
|
|
|
|
|
|
|
|
Labour Party |
Seamus Ryan* |
17.46 |
1,051 |
|
|
|
|
|
|
|
|
|
|
Fianna Fáil |
Tom Murphy* |
11.97 |
721 |
756 |
788 |
812 |
818 |
864 |
|
|
|
|
|
Independent |
Laurence (Cha) O'Neill* |
9.58 |
577 |
609 |
654 |
709 |
718 |
756 |
788 |
875 |
|
|
|
Fine Gael |
Mary O'Halloran* |
6.61 |
398 |
411 |
426 |
454 |
461 |
488 |
499 |
541 |
545 |
617 |
|
Fianna Fáil |
Chuck O'Connell |
4.70 |
283 |
294 |
308 |
321 |
323 |
342 |
353 |
|
|
|
|
Green Party |
Catherine Kinsella |
3.31 |
199 |
220 |
252 |
274 |
291 |
314 |
381 |
423 |
429 |
508 |
|
Independent |
Jim Boland |
3.11 |
187 |
212 |
248 |
260 |
277 |
280 |
|
|
|
|
|
Progressive Democrats |
Padraig O Griofa |
2.82 |
170 |
178 |
185 |
195 |
196 |
|
|
|
|
|
|
Workers' Party |
Billy McCarthy* |
2.51 |
151 |
255 |
293 |
312 |
327 |
340 |
388 |
420 |
424 |
|
|
Socialist Workers |
Roy Hassey |
0.86 |
52 |
65 |
94 |
101 |
|
|
|
|
|
|
| Electorate: 10,649 Valid: 6,021 (56.54%) Spoilt: 139 Quota: 861 Turnout: 6,160 (57.85%) |
External links
