Philippine House of Representatives elections, 2004
| | |||||||||||||||||||||||||||||||||||||||||||||||||||||||||||||||||||||
| |||||||||||||||||||||||||||||||||||||||||||||||||||||||||||||||||||||
| |||||||||||||||||||||||||||||||||||||||||||||||||||||||||||||||||||||
|
| |||||||||||||||||||||||||||||||||||||||||||||||||||||||||||||||||||||
| |||||||||||||||||||||||||||||||||||||||||||||||||||||||||||||||||||||
 |
| This article is part of a series on the politics and government of the Philippines |
|
Legislature
|
|
Constitutional Commissions |
The Elections for the House of Representatives of the Philippines were held on May 10, 2004. Being held together with presidential election, the party of the incumbent president Gloria Macapagal Arroyo, Lakas-Christian Muslim Democrats, and by extension the administration-led coalition, the Koalisyon ng Katapatan at Karanasan sa Kinabukasan (K4), won majority of the seats in the House of Representatives.[1]
The elected representatives served in the 13th Congress from 2004 to 2007.
Results
| ||||||||||||||||
|
Elections for representatives from districts
| Parties and coalitions | Seats | % | |
|---|---|---|---|
| Lakas | 92 | 37.2% | |
| NPC | 53 | 21.5% | |
| Liberal | 29 | 11.8% | |
| LDP | 15 | 6.1% | |
| PMP | 5 | 2.0% | |
| Aksyon | 2 | 0.8% | |
| KAMPI | 2 | 0.8% | |
| Nacionalista | 2 | 0.8% | |
| PDP-Laban | 2 | 0.8% | |
| KBL | 1 | 0.4% | |
| PDSP | 1 | 0.4% | |
| Reporma-LM | 1 | 0.4% | |
| Independent | 4 | 1.6% | |
| Totals | 209 | 84.6% | |
Election for sectoral representatives

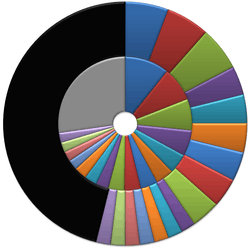
Result of the Philippine House of Representatives party-list election. Proportion of votes (inner ring) as compared to proportion of seats (outer ring) of the political parties. Parties that did not win any seat are represented by a gray pie slice, unfilled seats due to the 3-seat cap and 2% threshold are denoted by a black slice.
| Party | Votes | % | Swing | Seats won |
|---|---|---|---|---|
| Bayan Muna | 1,203,305 | 9.46% | 3 | |
| APEC | 934,995 | 7.35% | 3 | |
| Akbayan | 852,473 | 6.70% | 3 | |
| Buhay | 705,730 | 5.55% | 2 | |
| Anakpawis | 538,396 | 4.23% | 2 | |
| CIBAC | 495,193 | 3.89% | 2 | |
| GABRIELA | 464,586 | 3.65% | 2 | |
| Partido ng Manggagawa | 448,072 | 3.52% | 2 | |
| Butil | 429,259 | 3.37% | 2 | |
| AVE | 343,498 | 2.70% | 1 | |
| Alagad | 340,977 | 2.68% | 1 | |
| VFP | 340,759 | 2.68% | 1 | |
| Coop-NATCCO | 270,950 | 2.13% | 1 | |
| AMIN | 269,750 | 2.12% | 1 | |
| ALIF | 269,345 | 2.11% | 1 | |
| An Waray | 268,164 | 2.11% | 1 | |
| ABA-AKO | 251,597 | 1.98% | 0 | |
| ANAD | 244,137 | 1.92% | 0 | |
| Senior Citizens/Elderly | 236,571 | 1.86% | 0 | |
| PGBI | 213,662 | 1.68% | 0 | |
| Anak ng Bayan | 213,068 | 1.67% | 0 | |
| TUCP | 201,396 | 1.58% | 0 | |
| Sanlakas | 189,517 | 1.49% | 0 | |
| Bigkis | 186,264 | 1.46% | 0 | |
| Suara Bangsamoro | 164,494 | 1.29% | 0 | |
| Cocofed | 163,952 | 1.29% | 0 | |
| Sagip-Kapwa | 161,797 | 1.27% | 0 | |
| Aksyon Sambayan | 156,467 | 1.23% | 0 | |
| PMAP | 144,740 | 1.14% | 0 | |
| BANAT | 143,454 | 1.13% | 0 | |
| Abay Pamilya | 133,952 | 1.05% | 0 | |
| SMILE | 133,425 | 1.05% | 0 | |
| Abanse! Pinay | 115,855 | 0.91% | 0 | |
| MIGRANTE | 110,507 | 0.87% | 0 | |
| Alab Katipunan | 92,262 | 0.73% | 0 | |
| Assalam | 91,975 | 0.72% | 0 | |
| Gabay OFW | 89,978 | 0.71% | 0 | |
| AKAPIN | 86,673 | 0.68% | 0 | |
| Pinoy Overseas | 79,214 | 0.62% | 0 | |
| Ahonbayan | 68,203 | 0.54% | 0 | |
| AASJS | 65,596 | 0.52% | 0 | |
| Seaman's Party | 65,231 | 0.52% | 0 | |
| Bahandi | 61,665 | 0.48% | 0 | |
| SCFO | 55,378 | 0.45% | 0 | |
| BTM | 52,919 | 0.42% | 0 | |
| ASAP | 50,063 | 0.39% | 0 | |
| Maritime Party | 48,037 | 0.38% | 0 | |
| AGRIFIL | 42,920 | 0.34% | 0 | |
| BANTAY | 42,050 | 0.33% | 0 | |
| MSCFO | 39,194 | 0.31% | 0 | |
| PCDO-ACTO | 38,093 | 0.30% | 0 | |
| OMMAR | 38,389 | 0.29% | 0 | |
| GRECON | 33,950 | 0.27% | 0 | |
| Lapiang Manggagawa | 31,386 | 0.25% | 0 | |
| PARP | 30,984 | 0.24% | 0 | |
| FFAPI | 28,739 | 0.23% | 0 | |
| Aging Pinoy | 27,609 | 0.22% | 0 | |
| KALOOB | 26,392 | 0.21% | 0 | |
| Katutubo | 22,370 | 0.18% | 0 | |
| Isang Bansa, Isang Diwa | 17,994 | 0.14% | 0 | |
| BISA | 13,340 | 0.10% | 0 | |
| NELFFI | 13,266 | 0.10% | 0 | |
| TRICAP | 8,753 | 0.07% | 0 | |
| FLRF | 8,660 | 0.07% | 0 | |
| Sandigang Maralita | 7,992 | 0.06% | 0 | |
| DWP | 3,900 | 0.04% | 0 | |
| Total | 12,721,952 | 100% | 28 | |
| Valid votes | 12,721,952 | 37.96% | | |
| Total turnout | 33,510,091 | 76.97% | | |
| Registered voters | 44,872,007 | 100% | | |
| Source: COMELEC | ||||
See also
References
- ↑ Quezon, Manuel III (2007-06-06). "An abnormal return to normality". PCIJ.org. Retrieved 2010-12-06.
Notes
- The Presidents of the Senate of the Republic of the Philippines. ISBN 971-8832-24-6.
- Pobre, Cesar P. Philippine Legislature 100 Years. ISBN 971-92245-0-9.
- Teehankee, Julio. "Electoral Politics in the Philippines" (PDF). quezon.ph. Retrieved 2010-12-06.
This article is issued from Wikipedia - version of the 10/24/2016. The text is available under the Creative Commons Attribution/Share Alike but additional terms may apply for the media files.


